Citibank 2014 Annual Report Download - page 27
Download and view the complete annual report
Please find page 27 of the 2014 Citibank annual report below. You can navigate through the pages in the report by either clicking on the pages listed below, or by using the keyword search tool below to find specific information within the annual report.-
 1
1 -
2
-
3
-
4
-
5
-
6
-
7
-
8
-
9
-
10
-
11
-
12
-
13
-
14
-
15
-
16
-
 17
17 -
 18
18 -
 19
19 -
 20
20 -
 21
21 -
 22
22 -
 23
23 -
 24
24 -
 25
25 -
 26
26 -
 27
27 -
 28
28 -
 29
29 -
 30
30 -
 31
31 -
 32
32 -
 33
33 -
 34
34 -
 35
35 -
 36
36 -
 37
37 -
38
-
39
-
40
-
41
-
42
-
43
-
44
-
45
-
46
-
47
-
48
-
49
-
50
-
51
-
52
-
53
-
54
-
55
-
56
-
57
-
58
-
59
-
60
-
61
-
62
-
63
-
64
-
65
-
66
-
67
-
68
-
69
-
70
-
71
-
72
-
73
-
74
-
75
-
76
-
77
-
78
-
79
-
80
-
81
-
82
-
83
-
84
-
85
-
86
-
87
-
88
-
89
-
90
-
91
-
92
-
93
-
94
-
95
-
96
-
97
-
98
-
99
-
100
-
101
-
102
-
103
-
104
-
105
-
106
-
107
-
108
-
109
-
110
-
111
-
112
-
113
-
114
-
115
-
116
-
117
-
118
-
119
-
120
-
121
-
122
-
123
-
124
-
125
-
126
-
127
-
128
-
129
-
130
-
131
-
132
-
133
-
134
-
135
-
136
-
137
-
138
-
139
-
140
-
141
-
142
-
143
-
144
-
145
-
146
-
147
-
148
-
149
-
150
-
151
-
152
-
153
-
154
-
155
-
156
-
157
-
158
-
159
-
160
-
161
-
162
-
163
-
164
-
165
-
166
-
167
-
168
-
169
-
170
-
171
-
172
-
173
-
174
-
175
-
176
-
177
-
178
-
179
-
180
-
181
-
182
-
183
-
184
-
185
-
186
-
187
-
188
-
189
-
190
-
191
-
192
-
193
-
194
-
195
-
196
-
197
-
198
-
199
-
200
-
201
-
202
-
203
-
204
-
205
-
206
-
207
-
208
-
209
-
210
-
211
-
212
-
213
-
214
-
215
-
216
-
217
-
218
-
219
-
220
-
221
-
222
-
223
-
224
-
225
-
226
-
227
-
228
-
229
-
230
-
231
-
232
-
233
-
234
-
235
-
236
-
237
-
238
-
239
-
240
-
241
-
242
-
243
-
244
-
245
-
246
-
247
-
248
-
249
-
250
-
251
-
252
-
253
-
254
-
255
-
256
-
257
-
258
-
259
-
260
-
261
-
262
-
263
-
264
-
265
-
266
-
267
-
268
-
269
-
270
-
271
-
272
-
273
-
274
-
275
-
276
-
277
-
278
-
279
-
280
-
281
-
282
-
283
-
284
-
285
-
286
-
287
-
288
-
289
-
290
-
291
-
292
-
293
-
294
-
295
-
296
-
297
-
298
-
299
-
300
-
301
-
302
-
303
-
304
-
305
-
306
-
307
-
308
-
309
-
310
-
311
-
312
-
313
-
314
-
315
-
316
-
317
-
318
-
319
-
320
-
321
-
322
-
323
-
324
-
325
-
326
-
327
 |
 |

10
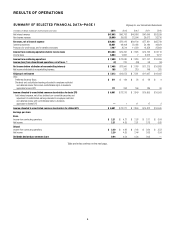
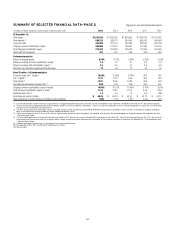
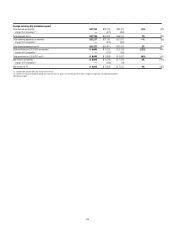
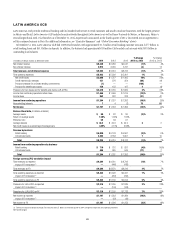
SUMMARY OF SELECTED FINANCIAL DATA—PAGE 2
In millions of dollars, except per-share amounts, ratios and direct staff 2014 2013 2012 2011 2010
At December 31:
Total assets $1,842,530 $1,880,382 $1,864,660 $1,873,878 $1,913,902
Total deposits (2) 899,332 968,273 930,560 865,936 844,968
Long-term debt 223,080 221,116 239,463 323,505 381,183
Citigroup common stockholders’ equity 200,066 197,601 186,487 177,494 163,156
Total Citigroup stockholders’ equity 210,534 204,339 189,049 177,806 163,468
Direct staff (in thousands) 241 251 259 266 260
Performance metrics
Return on average assets 0.39% 0.73% 0.39% 0.55% 0.53%
Return on average common stockholders’ equity (3) 3.4 7.0 4.1 6.3 6.8
Return on average total stockholders’ equity (3) 3.5 6.9 4.1 6.3 6.8
Efficiency ratio (Operating expenses/Total revenues) 72 63 72 65 55
Basel III ratios - full implementation
Common Equity Tier 1 Capital (4) 10.58% 10.59% 8.74% N/A N/A
Tier 1 Capital (4) 11.47 11.25 9.05 N/A N/A
Total Capital (4) 12.81 12.65 10.83 N/A N/A
Estimated supplementary leverage ratio (5) 5.96 5.43 N/A N/A N/A
Citigroup common stockholders’ equity to assets 10.86% 10.51% 10.00% 9.47% 8.52%
Total Citigroup stockholders’ equity to assets 11.43 10.87 10.14 9.49 8.54
Dividend payout ratio (6) 1.8 0.9 1.6 0.8 NM
Book value per common share $ 66.16 $ 65.23 $ 61.57 $ 60.70 $ 56.15
Ratio of earnings to fixed charges and preferred stock dividends 1.98x 2.16x 1.37x 1.60x 1.51x
(1) Discontinued operations include Credicard, Citi Capital Advisors and Egg Banking credit card business. See Note 2 to the Consolidated Financial Statements for additional information on Citi’s discontinued operations.
(2) Reflects reclassification of approximately $21 billion of deposits to held-for-sale (Other liabilities) at December 31, 2014 as a result of the agreement to sell Citi’s retail banking business in Japan. See “Asia GCB” below
and Note 2 to the Consolidated Financial Statements.
(3) The return on average common stockholders’ equity is calculated using net income less preferred stock dividends divided by average common stockholders’ equity. The return on average total Citigroup stockholders’
equity is calculated using net income divided by average Citigroup stockholders’ equity.
(4) Capital ratios based on the final U.S. Basel III rules, with full implementation assumed for capital components; risk-weighted assets based on the Advanced Approaches for determining total risk-weighted assets. See
“Capital Resources” below.
(5) Citi’s estimated Supplementary Leverage ratio is based on the revised final U.S. Basel III rules issued in September 2014 and represents the ratio of Tier 1 Capital to Total Leverage Exposure (TLE). TLE is the sum of the
daily average of on-balance sheet assets for the quarter and the average of certain off-balance sheet exposures calculated as of the last day of each month in the quarter, less applicable Tier 1 Capital deductions. See
“Capital Resources” below.
(6) Dividends declared per common share as a percentage of net income per diluted share.
N/A Not applicable to 2012, 2011 and 2010. See “Capital Resources” below.
NM Not meaningful
Citigroup Inc. and Consolidated Subsidiaries