Citibank 2014 Annual Report Download - page 281
Download and view the complete annual report
Please find page 281 of the 2014 Citibank annual report below. You can navigate through the pages in the report by either clicking on the pages listed below, or by using the keyword search tool below to find specific information within the annual report.-
 1
1 -
2
-
3
-
4
-
5
-
6
-
7
-
8
-
9
-
10
-
11
-
12
-
13
-
14
-
15
-
16
-
17
-
18
-
19
-
20
-
21
-
22
-
23
-
24
-
25
-
26
-
27
-
28
-
29
-
30
-
31
-
32
-
33
-
34
-
35
-
36
-
37
-
38
-
39
-
40
-
41
-
42
-
43
-
44
-
45
-
46
-
47
-
48
-
49
-
50
-
51
-
52
-
53
-
54
-
55
-
56
-
57
-
58
-
59
-
60
-
61
-
62
-
63
-
64
-
65
-
66
-
67
-
68
-
69
-
70
-
71
-
72
-
73
-
74
-
75
-
76
-
77
-
78
-
79
-
80
-
81
-
82
-
83
-
84
-
85
-
86
-
87
-
88
-
89
-
90
-
91
-
92
-
93
-
94
-
95
-
96
-
97
-
98
-
99
-
100
-
101
-
102
-
103
-
104
-
105
-
106
-
107
-
108
-
109
-
110
-
111
-
112
-
113
-
114
-
115
-
116
-
117
-
118
-
119
-
120
-
121
-
122
-
123
-
124
-
125
-
126
-
127
-
128
-
129
-
130
-
131
-
132
-
133
-
134
-
135
-
136
-
137
-
138
-
139
-
140
-
141
-
142
-
143
-
144
-
145
-
146
-
147
-
148
-
149
-
150
-
151
-
152
-
153
-
154
-
155
-
156
-
157
-
158
-
159
-
160
-
161
-
162
-
163
-
164
-
165
-
166
-
167
-
168
-
169
-
170
-
171
-
172
-
173
-
174
-
175
-
176
-
177
-
178
-
179
-
180
-
181
-
182
-
183
-
184
-
185
-
186
-
187
-
188
-
189
-
190
-
191
-
192
-
193
-
194
-
195
-
196
-
197
-
198
-
199
-
200
-
201
-
202
-
203
-
204
-
205
-
206
-
207
-
208
-
209
-
210
-
211
-
212
-
213
-
214
-
215
-
216
-
217
-
218
-
219
-
220
-
221
-
222
-
223
-
224
-
225
-
226
-
227
-
228
-
229
-
230
-
231
-
232
-
233
-
234
-
235
-
236
-
237
-
238
-
239
-
240
-
241
-
242
-
243
-
244
-
245
-
246
-
247
-
248
-
249
-
250
-
251
-
252
-
253
-
254
-
255
-
256
-
257
-
258
-
259
-
260
-
261
-
262
-
263
-
264
-
265
-
266
-
267
-
268
-
269
-
270
-
 271
271 -
 272
272 -
 273
273 -
 274
274 -
 275
275 -
 276
276 -
 277
277 -
 278
278 -
 279
279 -
 280
280 -
 281
281 -
 282
282 -
 283
283 -
 284
284 -
 285
285 -
 286
286 -
 287
287 -
 288
288 -
 289
289 -
 290
290 -
 291
291 -
292
-
293
-
294
-
295
-
296
-
297
-
298
-
299
-
300
-
301
-
302
-
303
-
304
-
305
-
306
-
307
-
308
-
309
-
310
-
311
-
312
-
313
-
314
-
315
-
316
-
317
-
318
-
319
-
320
-
321
-
322
-
323
-
324
-
325
-
326
-
327
 |
 |

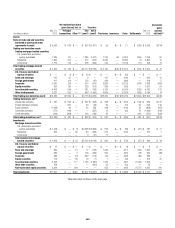
264
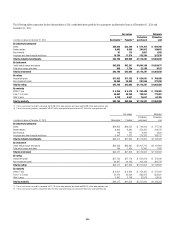
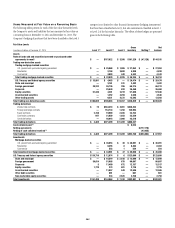
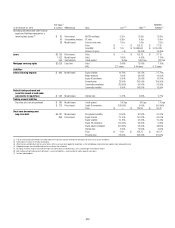
Fair Value Levels
In millions of dollars at December 31, 2013 Level 1 (1) Level 2 (1) Level 3
Gross
inventory Netting (2)
Net
balance
Assets
Federal funds sold and securities borrowed or purchased under
agreements to resell $ — $ 172,848 $ 3,566 $ 176,414 $ (32,331) $144,083
Trading non-derivative assets
Trading mortgage-backed securities
U.S. government-sponsored agency guaranteed — 22,861 1,094 23,955 — 23,955
Residential — 1,223 2,854 4,077 — 4,077
Commercial — 2,318 256 2,574 — 2,574
Total trading mortgage-backed securities $ — $ 26,402 $ 4,204 $ 30,606 $ — $ 30,606
U.S. Treasury and federal agency securities $ 12,080 $ 2,757 $ — $ 14,837 $ — $ 14,837
State and municipal — 2,985 222 3,207 — 3,207
Foreign government 49,220 25,220 416 74,856 — 74,856
Corporate — 28,699 1,835 30,534 — 30,534
Equity securities 58,761 1,958 1,057 61,776 — 61,776
Asset-backed securities — 1,274 4,342 5,616 — 5,616
Other trading assets — 8,491 3,184 11,675 — 11,675
Total trading non-derivative assets $120,061 $ 97,786 $15,260 $ 233,107 $ — $233,107
Trading derivatives
Interest rate contracts $ 11 $ 624,902 $ 3,467 $ 628,380
Foreign exchange contracts 40 91,189 1,325 92,554
Equity contracts 5,793 17,611 1,473 24,877
Commodity contracts 506 7,775 801 9,082
Credit derivatives — 37,336 3,010 40,346
Total trading derivatives $ 6,350 $ 778,813 $10,076 $ 795,239
Cash collateral paid (3) $ 6,073
Netting agreements $(713,598)
Netting of cash collateral received (6) (34,893)
Total trading derivatives $ 6,350 $ 778,813 $10,076 $ 801,312 $(748,491) $ 52,821
Investments
Mortgage-backed securities
U.S. government-sponsored agency guaranteed $ — $ 41,810 $ 187 $ 41,997 $ — $ 41,997
Residential — 10,103 102 10,205 — 10,205
Commercial — 453 — 453 — 453
Total investment mortgage-backed securities $ — $ 52,366 $ 289 $ 52,655 $ — $ 52,655
U.S. Treasury and federal agency securities $ 69,139 $ 18,449 $ 8 $ 87,596 $ — $ 87,596
State and municipal $ — $ 17,297 $ 1,643 $ 18,940 $ — $ 18,940
Foreign government 35,179 60,948 344 96,471 — 96,471
Corporate 4 10,841 285 11,130 — 11,130
Equity securities 2,583 336 815 3,734 — 3,734
Asset-backed securities — 13,314 1,960 15,274 — 15,274
Other debt securities — 661 50 711 — 711
Non-marketable equity securities — 358 4,347 4,705 — 4,705
Total investments $106,905 $ 174,570 $ 9,741 $ 291,216 $ — $291,216
Table and notes continue on the next page.