Citibank 2014 Annual Report Download - page 93
Download and view the complete annual report
Please find page 93 of the 2014 Citibank annual report below. You can navigate through the pages in the report by either clicking on the pages listed below, or by using the keyword search tool below to find specific information within the annual report.-
 1
1 -
2
-
3
-
4
-
5
-
6
-
7
-
8
-
9
-
10
-
11
-
12
-
13
-
14
-
15
-
16
-
17
-
18
-
19
-
20
-
21
-
22
-
23
-
24
-
25
-
26
-
27
-
28
-
29
-
30
-
31
-
32
-
33
-
34
-
35
-
36
-
37
-
38
-
39
-
40
-
41
-
42
-
43
-
44
-
45
-
46
-
47
-
48
-
49
-
50
-
51
-
52
-
53
-
54
-
55
-
56
-
57
-
58
-
59
-
60
-
61
-
62
-
63
-
64
-
65
-
66
-
67
-
68
-
69
-
70
-
71
-
72
-
73
-
74
-
75
-
76
-
77
-
78
-
79
-
80
-
81
-
82
-
 83
83 -
 84
84 -
 85
85 -
 86
86 -
 87
87 -
 88
88 -
 89
89 -
 90
90 -
 91
91 -
 92
92 -
 93
93 -
 94
94 -
 95
95 -
 96
96 -
 97
97 -
 98
98 -
 99
99 -
 100
100 -
 101
101 -
 102
102 -
 103
103 -
104
-
105
-
106
-
107
-
108
-
109
-
110
-
111
-
112
-
113
-
114
-
115
-
116
-
117
-
118
-
119
-
120
-
121
-
122
-
123
-
124
-
125
-
126
-
127
-
128
-
129
-
130
-
131
-
132
-
133
-
134
-
135
-
136
-
137
-
138
-
139
-
140
-
141
-
142
-
143
-
144
-
145
-
146
-
147
-
148
-
149
-
150
-
151
-
152
-
153
-
154
-
155
-
156
-
157
-
158
-
159
-
160
-
161
-
162
-
163
-
164
-
165
-
166
-
167
-
168
-
169
-
170
-
171
-
172
-
173
-
174
-
175
-
176
-
177
-
178
-
179
-
180
-
181
-
182
-
183
-
184
-
185
-
186
-
187
-
188
-
189
-
190
-
191
-
192
-
193
-
194
-
195
-
196
-
197
-
198
-
199
-
200
-
201
-
202
-
203
-
204
-
205
-
206
-
207
-
208
-
209
-
210
-
211
-
212
-
213
-
214
-
215
-
216
-
217
-
218
-
219
-
220
-
221
-
222
-
223
-
224
-
225
-
226
-
227
-
228
-
229
-
230
-
231
-
232
-
233
-
234
-
235
-
236
-
237
-
238
-
239
-
240
-
241
-
242
-
243
-
244
-
245
-
246
-
247
-
248
-
249
-
250
-
251
-
252
-
253
-
254
-
255
-
256
-
257
-
258
-
259
-
260
-
261
-
262
-
263
-
264
-
265
-
266
-
267
-
268
-
269
-
270
-
271
-
272
-
273
-
274
-
275
-
276
-
277
-
278
-
279
-
280
-
281
-
282
-
283
-
284
-
285
-
286
-
287
-
288
-
289
-
290
-
291
-
292
-
293
-
294
-
295
-
296
-
297
-
298
-
299
-
300
-
301
-
302
-
303
-
304
-
305
-
306
-
307
-
308
-
309
-
310
-
311
-
312
-
313
-
314
-
315
-
316
-
317
-
318
-
319
-
320
-
321
-
322
-
323
-
324
-
325
-
326
-
327
 |
 |

76
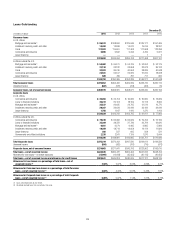
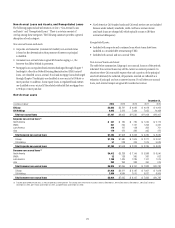
(1) 2012 includes approximately $635 million of incremental charge-offs related to the Office of the Comptroller of the Currency (OCC) guidance issued in the third quarter of 2012, which required mortgage loans to
borrowers that have gone through Chapter 7 U.S. Bankruptcy Code to be written down to collateral value. There was a corresponding approximate $600 million release in the third quarter of 2012 allowance for loans
losses related to these charge-offs. 2012 also includes a benefit to charge-offs of approximately $40 million related to finalizing the impact of the OCC guidance in the fourth quarter of 2012.
(2) 2012 includes approximately $370 million of incremental charge-offs related to previously deferred principal balances on modified loans in the first quarter of 2012. These charge-offs were related to anticipated
forgiveness of principal in connection with the national mortgage settlement. There was a corresponding approximate $350 million reserve release in the first quarter of 2012 related to these charge-offs.
(3) Recoveries have been reduced by certain collection costs that are incurred only if collection efforts are successful.
(4) Includes all adjustments to the allowance for credit losses, such as changes in the allowance from acquisitions, dispositions, securitizations, foreign currency translation, purchase accounting adjustments, etc.
(5) 2014 includes reductions of approximately $1.1 billion related to the sale or transfer to held-for-sale (HFS) of various loan portfolios, which includes approximately $411 million related to the transfer of various
real estate loan portfolios to HFS, approximately $204 million related to the transfer to HFS of a business in Greece, approximately $177 million related to the transfer to HFS of a business in Spain, approximately
$29 million related to the transfer to HFS of a business in Honduras and approximately $108 million related to the transfer to HFS of various EMEA loan portfolios. Additionally, 2014 includes a reduction of
approximately $463 million related to foreign currency translation.
(6) 2013 includes reductions of approximately $2.4 billion related to the sale or transfer to held-for-sale of various loan portfolios, which includes approximately $360 million related to the sale of Credicard and
approximately $255 million related to a transfer to held-for-sale of a loan portfolio in Greece, approximately $230 million related to a non-provision transfer of reserves associated with deferred interest to Other assets
which includes deferred interest and approximately $220 million related to foreign currency translation.
(7) 2012 includes reductions of approximately $875 million related to the sale or transfer to held-for-sale of various U.S. loan portfolios.
(8) 2011 includes reductions of approximately $1.6 billion related to the sale or transfer to held-for-sale of various U.S. loan portfolios, approximately $240 million related to the sale of the Egg Banking PLC credit card
business, approximately $72 million related to the transfer of the Citi Belgium business to held-for-sale and approximately $290 million related to FX translation.
(9) 2010 primarily includes an addition of $13.4 billion related to the impact of consolidating entities in connection with Citi’s adoption of SFAS 166/167, reductions of approximately $2.7 billion related to the sale or
transfer to held-for-sale of various U.S. loan portfolios and approximately $290 million related to the transfer of a U.K. first mortgage portfolio to held-for-sale.
(10) December 31, 2014, December 31, 2013, December 31, 2012, December 31, 2011 and December 31, 2010 exclude $5.9 billion, $5.0 billion, $5.3 billion, $5.3 billion and $4.4 billion, respectively, of loans which are
carried at fair value.
(11) Represents additional credit loss reserves for unfunded lending commitments and letters of credit recorded in Other liabilities on the Consolidated Balance Sheet.
(12) Allowance for loan losses represents management’s best estimate of probable losses inherent in the portfolio, as well as probable losses related to large individually evaluated impaired loans and troubled debt
restructurings. See “Significant Accounting Policies and Significant Estimates” and Note 1 to the Consolidated Financial Statements below. Attribution of the allowance is made for analytical purposes only and the entire
allowance is available to absorb probable credit losses inherent in the overall portfolio.
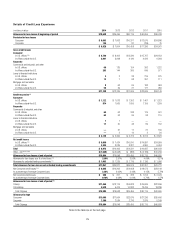
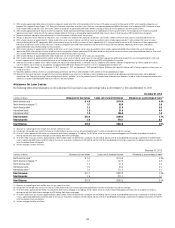
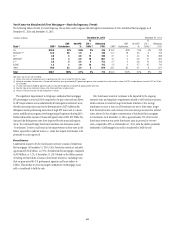
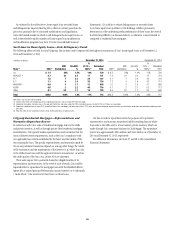
Allowance for Loan Losses
The following tables detail information on Citi’s allowance for loan losses, loans and coverage ratios as of December 31, 2014 and December 31, 2013:
December 31, 2014
In billions of dollars Allowance for loan losses Loans, net of unearned income Allowance as a percentage of loans (1)
North America cards (2) $ 4.9 $114.0 4.3%
North America mortgages (3)(4) 3.7 95.9 3.9
North America other 1.2 21.6 5.6
International cards 1.9 31.5 6.0
International other (5) 1.9 106.9 1.8
Total Consumer $13.6 $ 369.9 3.7%
Total Corporate 2.4 274.7 0.9
Total Citigroup $16.0 $ 644.6 2.5%
(1) Allowance as a percentage of loans excludes loans that are carried at fair value.
(2) Includes both Citi-branded cards and Citi retail services. The $4.9 billion of loan loss reserves represented approximately 15 months of coincident net credit loss coverage.
(3) Of the $3.7 billion, approximately $3.5 billion was allocated to North America mortgages in Citi Holdings. The $3.7 billion of loan loss reserves represented approximately 53 months of coincident net credit loss
coverage (for both total North America mortgages and Citi Holdings North America mortgages).
(4) Of the $3.7 billion in loan loss reserves, approximately $1.2 billion and $2.5 billion are determined in accordance with ASC 450-20 and ASC 310-10-35 (troubled debt restructurings), respectively. Of the $95.9 billion
in loans, approximately $80.4 billion and $15.2 billion of the loans are evaluated in accordance with ASC 450-20 and ASC 310-10-35 (troubled debt restructurings), respectively. For additional information, see Note 16
to the Consolidated Financial Statements.
(5) Includes mortgages and other retail loans.
December 31, 2013
In billions of dollars Allowance for loan losses Loans, net of unearned income Allowance as a percentage of loans (1)
North America cards (2) $ 6.2 $ 116.8 5.3%
North America mortgages (3)(4) 5.1 107.5 4.8
North America other 1.2 21.9 5.4
International cards 2.3 36.2 6.5
International other (5) 2.2 111.4 2.0
Total Consumer $17.0 $ 393.8 4.3%
Total Corporate 2.6 271.7 1.0
Total Citigroup $19.6 $ 665.5 3.0%
(1) Allowance as a percentage of loans excludes loans that are carried at fair value.
(2) Includes both Citi-branded cards and Citi retail services. The $6.2 billion of loan loss reserves represented approximately 18 months of coincident net credit loss coverage.
(3) Of the $5.1 billion, approximately $4.9 billion was allocated to North America mortgages in Citi Holdings. The $5.1 billion of loan loss reserves represented approximately 26 months of coincident net credit loss
coverage (for both total North America mortgages and Citi Holdings North America mortgages).
(4) Of the $5.1 billion in loan loss reserves, approximately $2.4 billion and $2.7 billion are determined in accordance with ASC 450-20 and ASC 310-10-35 (troubled debt restructurings), respectively. Of the $107.5 billion
in loans, approximately $88.6 billion and $18.5 billion of the loans are evaluated in accordance with ASC 450-20 and ASC 310-10-35 (troubled debt restructurings), respectively. For additional information, see Note 16
to the Consolidated Financial Statements.
(5) Includes mortgages and other retail loans.