Citibank 2014 Annual Report Download - page 178
Download and view the complete annual report
Please find page 178 of the 2014 Citibank annual report below. You can navigate through the pages in the report by either clicking on the pages listed below, or by using the keyword search tool below to find specific information within the annual report.-
 1
1 -
2
-
3
-
4
-
5
-
6
-
7
-
8
-
9
-
10
-
11
-
12
-
13
-
14
-
15
-
16
-
17
-
18
-
19
-
20
-
21
-
22
-
23
-
24
-
25
-
26
-
27
-
28
-
29
-
30
-
31
-
32
-
33
-
34
-
35
-
36
-
37
-
38
-
39
-
40
-
41
-
42
-
43
-
44
-
45
-
46
-
47
-
48
-
49
-
50
-
51
-
52
-
53
-
54
-
55
-
56
-
57
-
58
-
59
-
60
-
61
-
62
-
63
-
64
-
65
-
66
-
67
-
68
-
69
-
70
-
71
-
72
-
73
-
74
-
75
-
76
-
77
-
78
-
79
-
80
-
81
-
82
-
83
-
84
-
85
-
86
-
87
-
88
-
89
-
90
-
91
-
92
-
93
-
94
-
95
-
96
-
97
-
98
-
99
-
100
-
101
-
102
-
103
-
104
-
105
-
106
-
107
-
108
-
109
-
110
-
111
-
112
-
113
-
114
-
115
-
116
-
117
-
118
-
119
-
120
-
121
-
122
-
123
-
124
-
125
-
126
-
127
-
128
-
129
-
130
-
131
-
132
-
133
-
134
-
135
-
136
-
137
-
138
-
139
-
140
-
141
-
142
-
143
-
144
-
145
-
146
-
147
-
148
-
149
-
150
-
151
-
152
-
153
-
154
-
155
-
156
-
157
-
158
-
159
-
160
-
161
-
162
-
163
-
164
-
165
-
166
-
167
-
 168
168 -
 169
169 -
 170
170 -
 171
171 -
 172
172 -
 173
173 -
 174
174 -
 175
175 -
 176
176 -
 177
177 -
 178
178 -
 179
179 -
 180
180 -
 181
181 -
 182
182 -
 183
183 -
 184
184 -
 185
185 -
 186
186 -
 187
187 -
 188
188 -
189
-
190
-
191
-
192
-
193
-
194
-
195
-
196
-
197
-
198
-
199
-
200
-
201
-
202
-
203
-
204
-
205
-
206
-
207
-
208
-
209
-
210
-
211
-
212
-
213
-
214
-
215
-
216
-
217
-
218
-
219
-
220
-
221
-
222
-
223
-
224
-
225
-
226
-
227
-
228
-
229
-
230
-
231
-
232
-
233
-
234
-
235
-
236
-
237
-
238
-
239
-
240
-
241
-
242
-
243
-
244
-
245
-
246
-
247
-
248
-
249
-
250
-
251
-
252
-
253
-
254
-
255
-
256
-
257
-
258
-
259
-
260
-
261
-
262
-
263
-
264
-
265
-
266
-
267
-
268
-
269
-
270
-
271
-
272
-
273
-
274
-
275
-
276
-
277
-
278
-
279
-
280
-
281
-
282
-
283
-
284
-
285
-
286
-
287
-
288
-
289
-
290
-
291
-
292
-
293
-
294
-
295
-
296
-
297
-
298
-
299
-
300
-
301
-
302
-
303
-
304
-
305
-
306
-
307
-
308
-
309
-
310
-
311
-
312
-
313
-
314
-
315
-
316
-
317
-
318
-
319
-
320
-
321
-
322
-
323
-
324
-
325
-
326
-
327
 |
 |

161
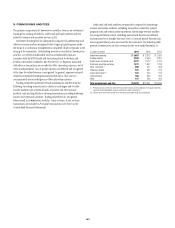
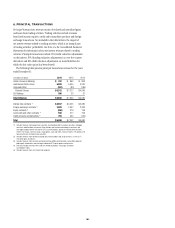
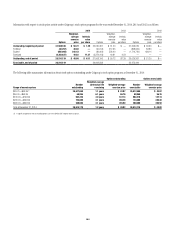
6. PRINCIPAL TRANSACTIONS
Principal transactions revenue consists of realized and unrealized gains
and losses from trading activities. Trading activities include revenues
from fixed income, equities, credit and commodities products and foreign
exchange transactions. Not included in the table below is the impact of
net interest revenue related to trading activities, which is an integral part
of trading activities’ profitability. See Note 4 to the Consolidated Financial
Statements for information about net interest revenue related to trading
activities. Principal transactions include CVA (credit valuation adjustments
on derivatives), FVA (funding valuation adjustments) on over-the-counter
derivatives and DVA (debt valuation adjustments on issued liabilities for
which the fair value option has been elected).
The following table presents principal transactions revenue for the years
ended December 31:
In millions of dollars 2014 2013 2012
Global Consumer Banking $ 787 $863 $ 808
Institutional Clients Group 5,908 6,494 4,330
Corporate/Other (383) (80) (189)
Subtotal Citicorp $6,312 $ 7,277 $ 4,949
Citi Holdings 386 25 31
Total Citigroup $ 6,698 $ 7,302 $ 4,980
Interest rate contracts (1) $ 3,657 $ 4,055 $ 2,380
Foreign exchange contracts (2) 2,008 2,307 2,493
Equity contracts (3) (260) 319 158
Commodity and other contracts (4) 590 277 108
Credit products and derivatives (5) 703 344 (159)
Total $ 6,698 $ 7,302 $ 4,980
(1) Includes revenues from government securities and corporate debt, municipal securities, mortgage
securities and other debt instruments. Also includes spot and forward trading of currencies and
exchange-traded and over-the-counter (OTC) currency options, options on fixed income securities,
interest rate swaps, currency swaps, swap options, caps and floors, financial futures, OTC options and
forward contracts on fixed income securities.
(2) Includes revenues from foreign exchange spot, forward, option and swap contracts, as well as FX
translation gains and losses.
(3) Includes revenues from common, preferred and convertible preferred stock, convertible corporate
debt, equity-linked notes and exchange-traded and OTC equity options and warrants.
(4) Primarily includes revenues from crude oil, refined oil products, natural gas and other
commodities trades.
(5) Includes revenues from structured credit products.