Citibank 2014 Annual Report Download - page 46
Download and view the complete annual report
Please find page 46 of the 2014 Citibank annual report below. You can navigate through the pages in the report by either clicking on the pages listed below, or by using the keyword search tool below to find specific information within the annual report.-
 1
1 -
2
-
3
-
4
-
5
-
6
-
7
-
8
-
9
-
10
-
11
-
12
-
13
-
14
-
15
-
16
-
17
-
18
-
19
-
20
-
21
-
22
-
23
-
24
-
25
-
26
-
27
-
28
-
29
-
30
-
31
-
32
-
33
-
34
-
35
-
 36
36 -
 37
37 -
 38
38 -
 39
39 -
 40
40 -
 41
41 -
 42
42 -
 43
43 -
 44
44 -
 45
45 -
 46
46 -
 47
47 -
 48
48 -
 49
49 -
 50
50 -
 51
51 -
 52
52 -
 53
53 -
 54
54 -
 55
55 -
 56
56 -
57
-
58
-
59
-
60
-
61
-
62
-
63
-
64
-
65
-
66
-
67
-
68
-
69
-
70
-
71
-
72
-
73
-
74
-
75
-
76
-
77
-
78
-
79
-
80
-
81
-
82
-
83
-
84
-
85
-
86
-
87
-
88
-
89
-
90
-
91
-
92
-
93
-
94
-
95
-
96
-
97
-
98
-
99
-
100
-
101
-
102
-
103
-
104
-
105
-
106
-
107
-
108
-
109
-
110
-
111
-
112
-
113
-
114
-
115
-
116
-
117
-
118
-
119
-
120
-
121
-
122
-
123
-
124
-
125
-
126
-
127
-
128
-
129
-
130
-
131
-
132
-
133
-
134
-
135
-
136
-
137
-
138
-
139
-
140
-
141
-
142
-
143
-
144
-
145
-
146
-
147
-
148
-
149
-
150
-
151
-
152
-
153
-
154
-
155
-
156
-
157
-
158
-
159
-
160
-
161
-
162
-
163
-
164
-
165
-
166
-
167
-
168
-
169
-
170
-
171
-
172
-
173
-
174
-
175
-
176
-
177
-
178
-
179
-
180
-
181
-
182
-
183
-
184
-
185
-
186
-
187
-
188
-
189
-
190
-
191
-
192
-
193
-
194
-
195
-
196
-
197
-
198
-
199
-
200
-
201
-
202
-
203
-
204
-
205
-
206
-
207
-
208
-
209
-
210
-
211
-
212
-
213
-
214
-
215
-
216
-
217
-
218
-
219
-
220
-
221
-
222
-
223
-
224
-
225
-
226
-
227
-
228
-
229
-
230
-
231
-
232
-
233
-
234
-
235
-
236
-
237
-
238
-
239
-
240
-
241
-
242
-
243
-
244
-
245
-
246
-
247
-
248
-
249
-
250
-
251
-
252
-
253
-
254
-
255
-
256
-
257
-
258
-
259
-
260
-
261
-
262
-
263
-
264
-
265
-
266
-
267
-
268
-
269
-
270
-
271
-
272
-
273
-
274
-
275
-
276
-
277
-
278
-
279
-
280
-
281
-
282
-
283
-
284
-
285
-
286
-
287
-
288
-
289
-
290
-
291
-
292
-
293
-
294
-
295
-
296
-
297
-
298
-
299
-
300
-
301
-
302
-
303
-
304
-
305
-
306
-
307
-
308
-
309
-
310
-
311
-
312
-
313
-
314
-
315
-
316
-
317
-
318
-
319
-
320
-
321
-
322
-
323
-
324
-
325
-
326
-
327
 |
 |

29
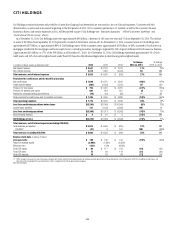
CITI HOLDINGS
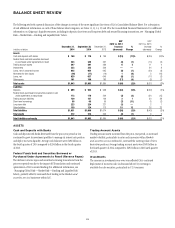
Citi Holdings contains businesses and portfolios of assets that Citigroup has determined are not central to its core Citicorp businesses. Consistent with this
determination, as previously announced, beginning in the first quarter of 2015, Citi’s consumer operations in 11 markets, as well as the consumer finance
business in Korea, and certain businesses in ICG, will be reported as part of Citi Holdings (see “Executive Summary,” “Global Consumer Banking” and
“Institutional Clients Group” above).
As of December 31, 2014, Citi Holdings assets were approximately $98 billion, a decrease of 16% year-over-year and 5% from September 30, 2014. The decline
in assets of $5 billion from September 30, 2014 primarily consisted of divestitures and run-off. As of December 31, 2014, consumer assets in Citi Holdings were
approximately $87 billion, or approximately 89% of Citi Holdings assets. Of the consumer assets, approximately $59 billion, or 68%, consisted of North America
mortgages (residential first mortgages and home equity loans), including consumer mortgages originated by Citi’s legacy CitiFinancial North America business
(approximately $10 billion, or 17%, of the $59 billion as of December 31, 2014). As of December 31, 2014, Citi Holdings represented approximately 5% of Citi’s
GAAP assets and 14% of its risk-weighted assets under Basel III (based on the Advanced Approaches for determining risk-weighted assets).
In millions of dollars, except as otherwise noted 2014 2013 2012
% Change
2014 vs. 2013
% Change
2013 vs. 2012
Net interest revenue $ 3,541 $ 3,184 $ 2,619 11% 22%
Non-interest revenue 2,274 1,382 (3,424) 65 NM
Total revenues, net of interest expense $ 5,815 $ 4,566 $ (805) 27% NM
Provisions for credit losses and for benefits and claims
Net credit losses $ 1,646 $ 3,070 $ 5,842 (46)% (47)%
Credit reserve release (893) (2,033) (1,551) 56 (31)
Provision for loan losses $ 753 $ 1,037 $ 4,291 (27)% (76)%
Provision for benefits and claims 602 618 651 (3) (5)
Release for unfunded lending commitments (10) (10) (56) —82
Total provisions for credit losses and for benefits and claims $ 1,345 $ 1,645 $ 4,886 (18)% (66)%
Total operating expenses $ 7,715 $ 5,970 $ 5,263 29% 13%
Loss from continuing operations before taxes $(3,245) $(3,049) $ (10,954) (6)% 72%
Income taxes (benefits) 121 (1,132) (4,389) NM 74
Loss from continuing operations $(3,366) $(1,917) $ (6,565) (76)% 71%
Noncontrolling interests $ 4 $ 16 $ 3 (75)% NM
Citi Holdings net loss $(3,370) $(1,933) $ (6,568) (74)% 71%
Total revenues, net of interest expense (excluding CVA/DVA)
Total revenues-as reported $ 5,815 $ 4,566 $ (805) 27% NM
CVA/DVA(1) (47) 3 157 NM (98)%
Total revenues-excluding CVA/DVA $ 5,862 $ 4,563 $ (962) 28% NM
Balance sheet data (in billions of dollars)
Average assets $ 109 $ 135 $ 194 (19)% (30)%
Return on average assets (3.09)% (1.43)% (3.39)%
Efficiency ratio 133% 131% (654)%
Total EOP assets $ 98 $ 117 $ 156 (16) (25)
Total EOP loans 73 93 116 (21) (20)
Total EOP deposits 10 36 68 (72) (47)
(1) 2014 includes the impact of a one-time pretax charge of $44 million related to the implementation of funding valuation adjustments (FVA) on derivatives in the third quarter of 2014. For additional information, see
Note 25 to the Consolidated Financial Statements. FVA is included within CVA for presentation purposes.
NM Not meaningful