Citibank 2014 Annual Report Download - page 98
Download and view the complete annual report
Please find page 98 of the 2014 Citibank annual report below. You can navigate through the pages in the report by either clicking on the pages listed below, or by using the keyword search tool below to find specific information within the annual report.-
 1
1 -
2
-
3
-
4
-
5
-
6
-
7
-
8
-
9
-
10
-
11
-
12
-
13
-
14
-
15
-
16
-
17
-
18
-
19
-
20
-
21
-
22
-
23
-
24
-
25
-
26
-
27
-
28
-
29
-
30
-
31
-
32
-
33
-
34
-
35
-
36
-
37
-
38
-
39
-
40
-
41
-
42
-
43
-
44
-
45
-
46
-
47
-
48
-
49
-
50
-
51
-
52
-
53
-
54
-
55
-
56
-
57
-
58
-
59
-
60
-
61
-
62
-
63
-
64
-
65
-
66
-
67
-
68
-
69
-
70
-
71
-
72
-
73
-
74
-
75
-
76
-
77
-
78
-
79
-
80
-
81
-
82
-
83
-
84
-
85
-
86
-
87
-
 88
88 -
 89
89 -
 90
90 -
 91
91 -
 92
92 -
 93
93 -
 94
94 -
 95
95 -
 96
96 -
 97
97 -
 98
98 -
 99
99 -
 100
100 -
 101
101 -
 102
102 -
 103
103 -
 104
104 -
 105
105 -
 106
106 -
 107
107 -
 108
108 -
109
-
110
-
111
-
112
-
113
-
114
-
115
-
116
-
117
-
118
-
119
-
120
-
121
-
122
-
123
-
124
-
125
-
126
-
127
-
128
-
129
-
130
-
131
-
132
-
133
-
134
-
135
-
136
-
137
-
138
-
139
-
140
-
141
-
142
-
143
-
144
-
145
-
146
-
147
-
148
-
149
-
150
-
151
-
152
-
153
-
154
-
155
-
156
-
157
-
158
-
159
-
160
-
161
-
162
-
163
-
164
-
165
-
166
-
167
-
168
-
169
-
170
-
171
-
172
-
173
-
174
-
175
-
176
-
177
-
178
-
179
-
180
-
181
-
182
-
183
-
184
-
185
-
186
-
187
-
188
-
189
-
190
-
191
-
192
-
193
-
194
-
195
-
196
-
197
-
198
-
199
-
200
-
201
-
202
-
203
-
204
-
205
-
206
-
207
-
208
-
209
-
210
-
211
-
212
-
213
-
214
-
215
-
216
-
217
-
218
-
219
-
220
-
221
-
222
-
223
-
224
-
225
-
226
-
227
-
228
-
229
-
230
-
231
-
232
-
233
-
234
-
235
-
236
-
237
-
238
-
239
-
240
-
241
-
242
-
243
-
244
-
245
-
246
-
247
-
248
-
249
-
250
-
251
-
252
-
253
-
254
-
255
-
256
-
257
-
258
-
259
-
260
-
261
-
262
-
263
-
264
-
265
-
266
-
267
-
268
-
269
-
270
-
271
-
272
-
273
-
274
-
275
-
276
-
277
-
278
-
279
-
280
-
281
-
282
-
283
-
284
-
285
-
286
-
287
-
288
-
289
-
290
-
291
-
292
-
293
-
294
-
295
-
296
-
297
-
298
-
299
-
300
-
301
-
302
-
303
-
304
-
305
-
306
-
307
-
308
-
309
-
310
-
311
-
312
-
313
-
314
-
315
-
316
-
317
-
318
-
319
-
320
-
321
-
322
-
323
-
324
-
325
-
326
-
327
 |
 |
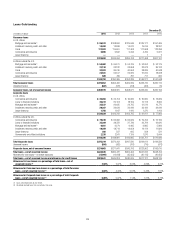
81
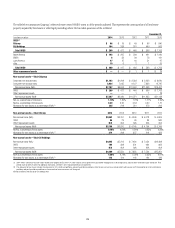
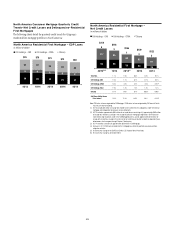
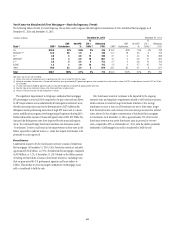
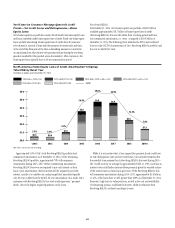
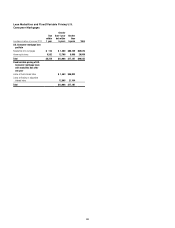
North America Consumer Mortgage Quarterly Credit
Trends—Net Credit Losses and Delinquencies—Residential
First Mortgages
The following charts detail the quarterly credit trends for Citigroup’s
residential first mortgage portfolio in North America.
4Q’143Q’142Q’141Q’144Q’13
36
9
31
35
9
32
32
8
33
29
8
34
27
8
33
North America Residential First Mortgage — EOP Loans
In billions of dollars
Citi Holdings - CMI Citi Holdings - CFNA Citicorp
$76 $75 $73 $68
$72
4Q’143Q’142Q’14(3)
1Q’144Q’13(1)(2)
95
117
5
95
95
3
59
90
7
54
83
2
26
91
5
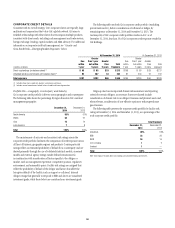
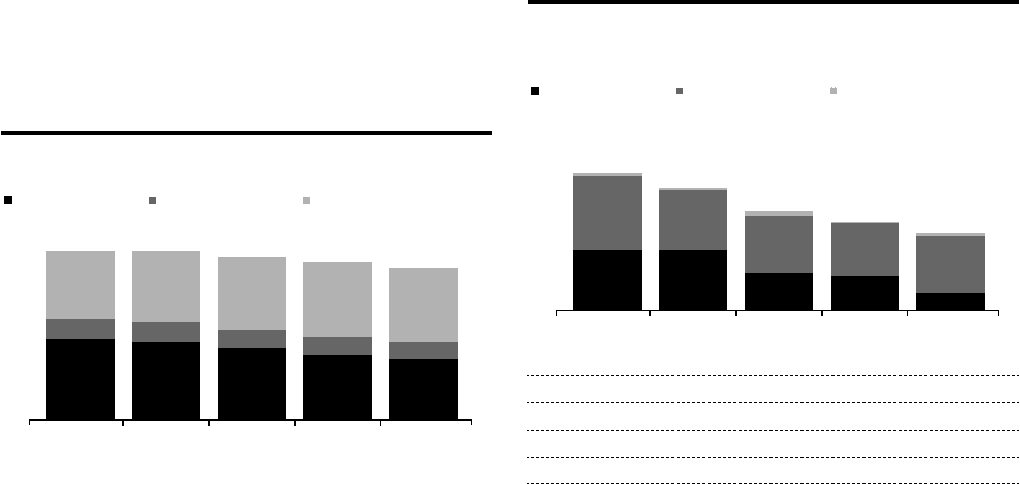
North America Residential First Mortgage —
Net Credit Losses
In millions of dollars
Citi Holdings - CMI Citi Holdings - CFNA Citicorp
$218 $193
$156
$122
$139
Total NCL 1.1% 1.0% 0.8% 0.8% 0.7%
Citi Holdings CMI 1.0% 1.1% 0.7% 0.7% 0.4%
Citi Holdings CFNA 5.0% 4.4% 4.2% 4.0% 4.6%(4)
Citi Holdings Total 1.9% 1.8% 1.4% 1.4% 1.3%
Citicorp 0.1% 0.0% 0.1% 0.02% 0.05%
S&P/Case Shiller Home
Price Index(5) 13.4% 12.4% 8.0% 4.8% 4.5%(6)
Note: CMI refers to loans originated by CitiMortgage. CFNA refers to loans originated by CitiFinancial. Totals
may not sum due to rounding.
(1) 4Q’13 includes $6 million of charge-offs related to Citi’s fulfillment of its obligations under the national
mortgage and independent foreclosure review settlements.
(2) 4Q’13 excludes approximately $84 million of net credit losses consisting of (i) approximately $69 million
of charge-offs related to a change in the charge-off policy for mortgages originated in CitiFinancial to
more closely align to policies used in the CitiMortgage business, and (ii) approximately $15 million of
charge-offs related to a change in the estimate of net credit losses related to collateral dependent loans
to borrowers who have gone through Chapter 7 bankruptcy.
(3) 2Q’14 excludes a recovery of approximately $58 million in CitiMortgage.
(4) Increase in 4Q’14 CitiFinancial residential first mortgage loss driven by portfolio seasoning and loss
mitigation activities.
(5) Year-over-year change in the S&P/Case-Shiller U.S. National Home Price Index.
(6) Year-over-year change as of October 2014.