Citibank 2014 Annual Report Download - page 92
Download and view the complete annual report
Please find page 92 of the 2014 Citibank annual report below. You can navigate through the pages in the report by either clicking on the pages listed below, or by using the keyword search tool below to find specific information within the annual report.-
 1
1 -
2
-
3
-
4
-
5
-
6
-
7
-
8
-
9
-
10
-
11
-
12
-
13
-
14
-
15
-
16
-
17
-
18
-
19
-
20
-
21
-
22
-
23
-
24
-
25
-
26
-
27
-
28
-
29
-
30
-
31
-
32
-
33
-
34
-
35
-
36
-
37
-
38
-
39
-
40
-
41
-
42
-
43
-
44
-
45
-
46
-
47
-
48
-
49
-
50
-
51
-
52
-
53
-
54
-
55
-
56
-
57
-
58
-
59
-
60
-
61
-
62
-
63
-
64
-
65
-
66
-
67
-
68
-
69
-
70
-
71
-
72
-
73
-
74
-
75
-
76
-
77
-
78
-
79
-
80
-
81
-
 82
82 -
 83
83 -
 84
84 -
 85
85 -
 86
86 -
 87
87 -
 88
88 -
 89
89 -
 90
90 -
 91
91 -
 92
92 -
 93
93 -
 94
94 -
 95
95 -
 96
96 -
 97
97 -
 98
98 -
 99
99 -
 100
100 -
 101
101 -
 102
102 -
103
-
104
-
105
-
106
-
107
-
108
-
109
-
110
-
111
-
112
-
113
-
114
-
115
-
116
-
117
-
118
-
119
-
120
-
121
-
122
-
123
-
124
-
125
-
126
-
127
-
128
-
129
-
130
-
131
-
132
-
133
-
134
-
135
-
136
-
137
-
138
-
139
-
140
-
141
-
142
-
143
-
144
-
145
-
146
-
147
-
148
-
149
-
150
-
151
-
152
-
153
-
154
-
155
-
156
-
157
-
158
-
159
-
160
-
161
-
162
-
163
-
164
-
165
-
166
-
167
-
168
-
169
-
170
-
171
-
172
-
173
-
174
-
175
-
176
-
177
-
178
-
179
-
180
-
181
-
182
-
183
-
184
-
185
-
186
-
187
-
188
-
189
-
190
-
191
-
192
-
193
-
194
-
195
-
196
-
197
-
198
-
199
-
200
-
201
-
202
-
203
-
204
-
205
-
206
-
207
-
208
-
209
-
210
-
211
-
212
-
213
-
214
-
215
-
216
-
217
-
218
-
219
-
220
-
221
-
222
-
223
-
224
-
225
-
226
-
227
-
228
-
229
-
230
-
231
-
232
-
233
-
234
-
235
-
236
-
237
-
238
-
239
-
240
-
241
-
242
-
243
-
244
-
245
-
246
-
247
-
248
-
249
-
250
-
251
-
252
-
253
-
254
-
255
-
256
-
257
-
258
-
259
-
260
-
261
-
262
-
263
-
264
-
265
-
266
-
267
-
268
-
269
-
270
-
271
-
272
-
273
-
274
-
275
-
276
-
277
-
278
-
279
-
280
-
281
-
282
-
283
-
284
-
285
-
286
-
287
-
288
-
289
-
290
-
291
-
292
-
293
-
294
-
295
-
296
-
297
-
298
-
299
-
300
-
301
-
302
-
303
-
304
-
305
-
306
-
307
-
308
-
309
-
310
-
311
-
312
-
313
-
314
-
315
-
316
-
317
-
318
-
319
-
320
-
321
-
322
-
323
-
324
-
325
-
326
-
327
 |
 |

75
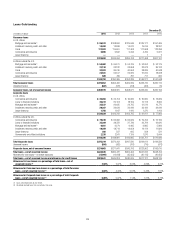
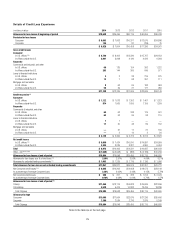
Details of Credit Loss Experience
In millions of dollars 2014 2013 2012 2011 2010
Allowance for loan losses at beginning of period $19,648 $25,455 $30,115 $40,655 $36,033
Provision for loan losses
Consumer $ 6,693 $ 7,603 $10,371 $12,075 $24,886
Corporate 135 1 87 (739) 75
$ 6,828 $ 7,604 $10,458 $11,336 $24,961
Gross credit losses
Consumer
In U.S. offices (1)(2) $ 6,780 $ 8,402 $12,226 $15,767 $24,183
In offices outside the U.S. 3,901 3,998 4,139 4,932 6,548
Corporate
Commercial and industrial, and other
In U.S. offices 66 125 154 392 1,222
In offices outside the U.S. 283 144 305 649 571
Loans to financial institutions
In U.S. offices 22 33 215 275
In offices outside the U.S. 13 7 68 391 111
Mortgage and real estate
In U.S. offices 862 59 182 953
In offices outside the U.S. 55 29 21 171 286
$11,108 $12,769 $17,005 $22,699 $34,149
Credit recoveries (3)
Consumer
In U.S. offices $ 1,122 $ 1,073 $ 1,302 $ 1,467 $ 1,323
In offices outside the U.S. 874 1,065 1,055 1,159 1,209
Corporate
Commercial & industrial, and other
In U.S. offices 64 62 243 175 591
In offices outside the U.S. 63 52 95 93 115
Loans to financial institutions
In U.S. offices 11 — — —
In offices outside the U.S. 11 20 43 89 132
Mortgage and real estate
In U.S. offices —31 17 27 130
In offices outside the U.S. —2 19 2 26
$ 2,135 $ 2,306 $ 2,774 $ 3,012 $ 3,526
Net credit losses
In U.S. offices (1)(2) $ 5,669 $ 7,424 $10,910 $14,887 $24,589
In offices outside the U.S. 3,304 3,039 3,321 4,800 6,034
Total $ 8,973 $10,463 $14,231 $19,687 $30,623
Other - net (4)(5)(6)(7)(8)(9) $ (1,509) $ (2,948) $ (887) $ (2,189) $10,284
Allowance for loan losses at end of period $15,994 $19,648 $25,455 $30,115 $40,655
Allowance for loan losses as a % of total loans (10) 2.50% 2.97% 3.92% 4.69% 6.31%
Allowance for unfunded lending commitments (11) $ 1,063 $ 1,229 $ 1,119 $ 1,136 $ 1,066
Total allowance for loan losses and unfunded lending commitments $17,057 $20,877 $26,574 $31,251 $41,721
Net Consumer credit losses (1)(2) $ 8,685 $10,262 $14,008 $18,073 $28,199
As a percentage of average Consumer loans 2.28% 2.63% 3.43% 4.15% 5.72%
Net Corporate credit losses $ 288 $ 201 $ 223 $ 1,614 $ 2,424
As a percentage of average Corporate loans 0.10% 0.08% 0.09% 0.79% 1.27%
Allowance for loan losses at end of period (12)
Citicorp $11,465 $13,174 $14,623 $16,699 $22,366
Citi Holdings 4,529 6,474 10,832 13,416 18,289
Total Citigroup $15,994 $19,648 $25,455 $30,115 $40,655
Allowance by type
Consumer $13,605 $17,064 $22,679 $27,236 $35,406
Corporate 2,389 2,584 2,776 2,879 5,249
Total Citigroup $15,994 $19,648 $25,455 $30,115 $40,655
Notes to the table are on the next page.