Citibank 2014 Annual Report Download - page 25
Download and view the complete annual report
Please find page 25 of the 2014 Citibank annual report below. You can navigate through the pages in the report by either clicking on the pages listed below, or by using the keyword search tool below to find specific information within the annual report.-
 1
1 -
2
-
3
-
4
-
5
-
6
-
7
-
8
-
9
-
10
-
11
-
12
-
13
-
14
-
 15
15 -
 16
16 -
 17
17 -
 18
18 -
 19
19 -
 20
20 -
 21
21 -
 22
22 -
 23
23 -
 24
24 -
 25
25 -
 26
26 -
 27
27 -
 28
28 -
 29
29 -
 30
30 -
 31
31 -
 32
32 -
 33
33 -
 34
34 -
 35
35 -
36
-
37
-
38
-
39
-
40
-
41
-
42
-
43
-
44
-
45
-
46
-
47
-
48
-
49
-
50
-
51
-
52
-
53
-
54
-
55
-
56
-
57
-
58
-
59
-
60
-
61
-
62
-
63
-
64
-
65
-
66
-
67
-
68
-
69
-
70
-
71
-
72
-
73
-
74
-
75
-
76
-
77
-
78
-
79
-
80
-
81
-
82
-
83
-
84
-
85
-
86
-
87
-
88
-
89
-
90
-
91
-
92
-
93
-
94
-
95
-
96
-
97
-
98
-
99
-
100
-
101
-
102
-
103
-
104
-
105
-
106
-
107
-
108
-
109
-
110
-
111
-
112
-
113
-
114
-
115
-
116
-
117
-
118
-
119
-
120
-
121
-
122
-
123
-
124
-
125
-
126
-
127
-
128
-
129
-
130
-
131
-
132
-
133
-
134
-
135
-
136
-
137
-
138
-
139
-
140
-
141
-
142
-
143
-
144
-
145
-
146
-
147
-
148
-
149
-
150
-
151
-
152
-
153
-
154
-
155
-
156
-
157
-
158
-
159
-
160
-
161
-
162
-
163
-
164
-
165
-
166
-
167
-
168
-
169
-
170
-
171
-
172
-
173
-
174
-
175
-
176
-
177
-
178
-
179
-
180
-
181
-
182
-
183
-
184
-
185
-
186
-
187
-
188
-
189
-
190
-
191
-
192
-
193
-
194
-
195
-
196
-
197
-
198
-
199
-
200
-
201
-
202
-
203
-
204
-
205
-
206
-
207
-
208
-
209
-
210
-
211
-
212
-
213
-
214
-
215
-
216
-
217
-
218
-
219
-
220
-
221
-
222
-
223
-
224
-
225
-
226
-
227
-
228
-
229
-
230
-
231
-
232
-
233
-
234
-
235
-
236
-
237
-
238
-
239
-
240
-
241
-
242
-
243
-
244
-
245
-
246
-
247
-
248
-
249
-
250
-
251
-
252
-
253
-
254
-
255
-
256
-
257
-
258
-
259
-
260
-
261
-
262
-
263
-
264
-
265
-
266
-
267
-
268
-
269
-
270
-
271
-
272
-
273
-
274
-
275
-
276
-
277
-
278
-
279
-
280
-
281
-
282
-
283
-
284
-
285
-
286
-
287
-
288
-
289
-
290
-
291
-
292
-
293
-
294
-
295
-
296
-
297
-
298
-
299
-
300
-
301
-
302
-
303
-
304
-
305
-
306
-
307
-
308
-
309
-
310
-
311
-
312
-
313
-
314
-
315
-
316
-
317
-
318
-
319
-
320
-
321
-
322
-
323
-
324
-
325
-
326
-
327
 |
 |
8
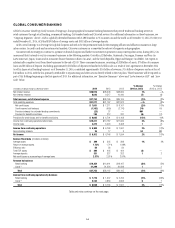
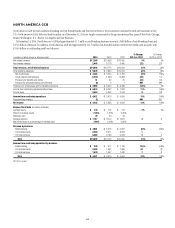
the deposits portfolios, partially offset by volume-related growth and gains
from branch sales during the year. Citi-branded cards revenues of $8.3 billion
were up 1% versus the prior year as purchase sales grew and an improvement
in spreads driven by a reduction in promotional rate balances mostly offset
the impact of lower average loans. Citi retail services revenues increased
4% to $6.5 billion, mainly reflecting the impact of the Best Buy portfolio
acquisition in September 2013, partially offset by continued declines in fee
revenues primarily reflecting higher yields and improving credit and the
resulting increase in contractual partner payments. North America GCB
average deposits of $171 billion grew 3% year-over-year and average retail
loans of $46 billion grew 9%. Average card loans of $110 billion increased
2%, and purchase sales of $252 billion increased 5% versus the prior year. For
additional information on the results of operations of North America GCB
for 2014, see “Global Consumer Banking—North America GCB” below.
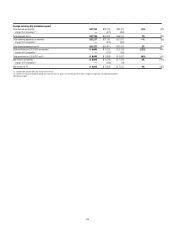
International GCB revenues (consisting of EMEA GCB, Latin America
GCB and Asia GCB) decreased 2% versus the prior year to $18.1 billion.
Excluding the impact of FX translation, international GCB revenues rose
2% from the prior year, driven by 4% growth in Latin America GCB and
1% growth in Asia GCB, partially offset by a 1% decline in EMEA GCB (for
the impact of FX translation on 2014 results of operations for each of EMEA
GCB, Latin America GCB and Asia GCB, see the table accompanying
the discussion of each respective business’ results of operations below).
The growth in international GCB revenues, excluding the impact of FX
translation, mainly reflected volume growth in all regions, partially offset
by spread compression, the ongoing impact of regulatory changes and the
repositioning of Citi’s franchise in Korea, as well as market exits in EMEA
GCB in 2013. For additional information on the results of operations of
EMEA GCB, Latin America GCB and Asia GCB for 2014, see “Global
Consumer Banking” below. Year-over-year, international GCB average
deposits increased 2%, average retail loans increased 7%, investment sales
increased 8%, average card loans increased 2% and card purchase sales
increased 5%, all excluding the impact of Credicard’s results in the prior year
period and FX translation.
ICG revenues were $33.3 billion in 2014, down 1% from the prior year.
Excluding CVA/DVA, ICG revenues were $33.6 billion, also down 1% from
the prior year. Banking revenues of $17.0 billion, excluding CVA/DVA and
the impact of mark-to-market gains/(losses) on hedges related to accrual
loans within corporate lending (see below), increased 5% from the prior year,
primarily reflecting growth in investment banking, corporate lending and
private bank revenues. Investment banking revenues increased 7% versus the
prior year, driven by an 11% increase in advisory revenues to $949 million
and an 18% increase in equity underwriting to $1.2 billion. Debt
underwriting revenues of $2.5 billion were largely unchanged from 2013.
Private bank revenues, excluding CVA/DVA, increased 7% to $2.7 billion from
the prior year, driven by increased client volumes and growth in investment
and capital markets products, partially offset by spread compression.
Corporate lending revenues rose 52% to $1.9 billion, including $116 million
of mark-to-market gains on hedges related to accrual loans compared to a
$287 million loss in the prior year. Excluding the mark-to-market impact on
hedges related to accrual loans in both periods, corporate lending revenues
rose 15% versus the prior year to $1.7 billion, primarily reflecting growth
in average loans and improved funding costs. Treasury and trade solutions
revenues increased by 1% versus the prior year to $7.9 billion as volume and
fee growth was largely offset by the impact of spread compression globally.
Markets and securities services revenues of $16.5 billion, excluding
CVA/DVA, decreased 8% from the prior year. Fixed income markets
revenues of $11.8 billion, excluding CVA/DVA, decreased 11% from the
prior year, reflecting weakness across rates and currencies, credit markets
and municipals due to challenging trading conditions, partially offset by
increased securitized products and commodities revenues. The first half of
2013 included a strong performance in rates and currencies, driven in part
by the impact of quantitative easing globally. Equity markets revenues of
$2.8 billion, excluding CVA/DVA, declined 1% versus the prior year, mostly
reflecting weakness in cash equities in EMEA driven by volatility in Europe,
partially offset by strength in prime finance. Securities services revenues of
$2.3 billion increased 3% versus the prior year primarily due to increased
volumes, assets under custody and overall client activity. For additional
information on the results of operations of ICG for 2014, see “Institutional
Clients Group” below.
Corporate/Other revenues decreased to $47 million from $121 million
in the prior year, driven mainly by lower revenues from sales of
available-for-sale securities as well as hedging activities. For additional
information on the results of operations of Corporate/Other in 2014, see
“Corporate/Other” below.
Citicorp end-of-period loans were roughly unchanged at $572 billion,
with 1% growth in corporate loans offset by a 2% decline in consumer loans.
Excluding the impact of FX translation, Citicorp loans grew 3%, with 4%
growth in corporate loans and 2% growth in consumer loans.
Citi Holdings
Citi Holdings’ net loss was $3.4 billion in 2014 compared to a net loss
of $1.9 billion in 2013. CVA/DVA was negative $47 million (negative
$29 million after-tax) in 2014, compared to positive $3 million (positive
$1 million after-tax) in the prior year. Excluding the impact of CVA/DVA
and the mortgage settlement in 2014, Citi Holdings’ net income was
$385 million, reflecting lower expenses, higher revenues and lower net credit
losses, partially offset by a lower net loan loss reserve release.
Citi Holdings’ revenues increased 27% to $5.8 billion from the prior year.
Excluding CVA/DVA, Citi Holdings’ revenues increased 28% to $5.9 billion
from the prior year. Net interest revenues increased 11% year-over-year to
$3.5 billion, largely driven by lower funding costs. Non-interest revenues,
excluding CVA/DVA, increased 68% to $2.3 billion from the prior year,
primarily driven by higher gains on assets sales and the absence of
repurchase reserve builds for representation and warranty claims in 2014. For
additional information on the results of operations of Citi Holdings in 2014,
see “Citi Holdings” below.
Citi Holdings’ assets were $98 billion, 16% below the prior year, and
represented approximately 5% of Citi’s total GAAP assets and 14% of its
risk-weighted assets under Basel III as of year end (based on the Advanced
Approaches for determining risk-weighted assets).