Citibank 2014 Annual Report Download - page 209
Download and view the complete annual report
Please find page 209 of the 2014 Citibank annual report below. You can navigate through the pages in the report by either clicking on the pages listed below, or by using the keyword search tool below to find specific information within the annual report.-
 1
1 -
2
-
3
-
4
-
5
-
6
-
7
-
8
-
9
-
10
-
11
-
12
-
13
-
14
-
15
-
16
-
17
-
18
-
19
-
20
-
21
-
22
-
23
-
24
-
25
-
26
-
27
-
28
-
29
-
30
-
31
-
32
-
33
-
34
-
35
-
36
-
37
-
38
-
39
-
40
-
41
-
42
-
43
-
44
-
45
-
46
-
47
-
48
-
49
-
50
-
51
-
52
-
53
-
54
-
55
-
56
-
57
-
58
-
59
-
60
-
61
-
62
-
63
-
64
-
65
-
66
-
67
-
68
-
69
-
70
-
71
-
72
-
73
-
74
-
75
-
76
-
77
-
78
-
79
-
80
-
81
-
82
-
83
-
84
-
85
-
86
-
87
-
88
-
89
-
90
-
91
-
92
-
93
-
94
-
95
-
96
-
97
-
98
-
99
-
100
-
101
-
102
-
103
-
104
-
105
-
106
-
107
-
108
-
109
-
110
-
111
-
112
-
113
-
114
-
115
-
116
-
117
-
118
-
119
-
120
-
121
-
122
-
123
-
124
-
125
-
126
-
127
-
128
-
129
-
130
-
131
-
132
-
133
-
134
-
135
-
136
-
137
-
138
-
139
-
140
-
141
-
142
-
143
-
144
-
145
-
146
-
147
-
148
-
149
-
150
-
151
-
152
-
153
-
154
-
155
-
156
-
157
-
158
-
159
-
160
-
161
-
162
-
163
-
164
-
165
-
166
-
167
-
168
-
169
-
170
-
171
-
172
-
173
-
174
-
175
-
176
-
177
-
178
-
179
-
180
-
181
-
182
-
183
-
184
-
185
-
186
-
187
-
188
-
189
-
190
-
191
-
192
-
193
-
194
-
195
-
196
-
197
-
198
-
 199
199 -
 200
200 -
 201
201 -
 202
202 -
 203
203 -
 204
204 -
 205
205 -
 206
206 -
 207
207 -
 208
208 -
 209
209 -
 210
210 -
 211
211 -
 212
212 -
 213
213 -
 214
214 -
 215
215 -
 216
216 -
 217
217 -
 218
218 -
 219
219 -
220
-
221
-
222
-
223
-
224
-
225
-
226
-
227
-
228
-
229
-
230
-
231
-
232
-
233
-
234
-
235
-
236
-
237
-
238
-
239
-
240
-
241
-
242
-
243
-
244
-
245
-
246
-
247
-
248
-
249
-
250
-
251
-
252
-
253
-
254
-
255
-
256
-
257
-
258
-
259
-
260
-
261
-
262
-
263
-
264
-
265
-
266
-
267
-
268
-
269
-
270
-
271
-
272
-
273
-
274
-
275
-
276
-
277
-
278
-
279
-
280
-
281
-
282
-
283
-
284
-
285
-
286
-
287
-
288
-
289
-
290
-
291
-
292
-
293
-
294
-
295
-
296
-
297
-
298
-
299
-
300
-
301
-
302
-
303
-
304
-
305
-
306
-
307
-
308
-
309
-
310
-
311
-
312
-
313
-
314
-
315
-
316
-
317
-
318
-
319
-
320
-
321
-
322
-
323
-
324
-
325
-
326
-
327
 |
 |

192
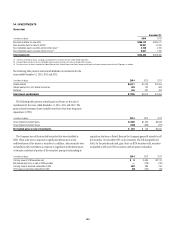
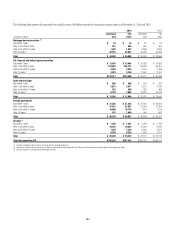
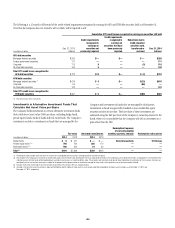
The table below shows the fair value of AFS securities that have been in an unrealized loss position for less than 12 months or for 12 months or longer as of
December 31, 2014 and 2013:
Less than 12 months 12 months or longer Total
In millions of dollars
Fair
value
Gross
unrealized
losses
Fair
value
Gross
unrealized
losses
Fair
value
Gross
unrealized
losses
December 31, 2014
Securities AFS
Mortgage-backed securities
U.S. government-sponsored agency guaranteed $ 4,198 $ 30 $ 5,547 $ 129 $ 9,745 $ 159
Prime 5 — 2 — 7 —
Non-U.S. residential 1,276 3 199 4 1,475 7
Commercial 124 1 136 2 260 3
Total mortgage-backed securities $ 5,603 $ 34 $ 5,884 $ 135 $ 11,487 $ 169
U.S. Treasury and federal agency securities
U.S. Treasury $ 36,581 $ 119 $ 1,013 $ 8 $ 37,594 $ 127
Agency obligations 5,698 9 754 4 6,452 13
Total U.S. Treasury and federal agency securities $ 42,279 $ 128 $ 1,767 $ 12 $ 44,046 $ 140
State and municipal $ 386 $ 15 $ 5,802 $ 962 $ 6,188 $ 977
Foreign government 18,495 147 5,984 139 24,479 286
Corporate 3,511 63 1,350 28 4,861 91
Asset-backed securities 3,701 13 3,816 45 7,517 58
Marketable equity securities AFS 51 4 218 40 269 44
Total securities AFS $ 74,026 $ 404 $ 24,821 $ 1,361 $ 98,847 $ 1,765
December 31, 2013
Securities AFS
Mortgage-backed securities
U.S. government-sponsored agency guaranteed $ 19,377 $ 533 $ 5,643 $ 355 $ 25,020 $ 888
Prime 85 3 3 — 88 3
Non-U.S. residential 2,103 4 5 — 2,108 4
Commercial 206 6 28 2 234 8
Total mortgage-backed securities $ 21,771 $ 546 $ 5,679 $ 357 $ 27,450 $ 903
U.S. Treasury and federal agency securities
U.S. Treasury $ 34,780 $ 133 $ 268 $ 14 $ 35,048 $ 147
Agency obligations 6,692 66 101 1 6,793 67
Total U.S. Treasury and federal agency securities $ 41,472 $ 199 $ 369 $ 15 $ 41,841 $ 214
State and municipal $ 595 $ 29 $ 11,447 $ 1,976 $ 12,042 $ 2,005
Foreign government 35,783 477 5,778 63 41,561 540
Corporate 4,565 108 387 11 4,952 119
Asset-backed securities 11,207 57 1,931 63 13,138 120
Marketable equity securities AFS 1,271 92 806 91 2,077 183
Total securities AFS $116,664 $ 1,508 $ 26,397 $ 2,576 $143,061 $ 4,084