Citibank 2014 Annual Report Download - page 100
Download and view the complete annual report
Please find page 100 of the 2014 Citibank annual report below. You can navigate through the pages in the report by either clicking on the pages listed below, or by using the keyword search tool below to find specific information within the annual report.-
 1
1 -
2
-
3
-
4
-
5
-
6
-
7
-
8
-
9
-
10
-
11
-
12
-
13
-
14
-
15
-
16
-
17
-
18
-
19
-
20
-
21
-
22
-
23
-
24
-
25
-
26
-
27
-
28
-
29
-
30
-
31
-
32
-
33
-
34
-
35
-
36
-
37
-
38
-
39
-
40
-
41
-
42
-
43
-
44
-
45
-
46
-
47
-
48
-
49
-
50
-
51
-
52
-
53
-
54
-
55
-
56
-
57
-
58
-
59
-
60
-
61
-
62
-
63
-
64
-
65
-
66
-
67
-
68
-
69
-
70
-
71
-
72
-
73
-
74
-
75
-
76
-
77
-
78
-
79
-
80
-
81
-
82
-
83
-
84
-
85
-
86
-
87
-
88
-
89
-
 90
90 -
 91
91 -
 92
92 -
 93
93 -
 94
94 -
 95
95 -
 96
96 -
 97
97 -
 98
98 -
 99
99 -
 100
100 -
 101
101 -
 102
102 -
 103
103 -
 104
104 -
 105
105 -
 106
106 -
 107
107 -
 108
108 -
 109
109 -
 110
110 -
111
-
112
-
113
-
114
-
115
-
116
-
117
-
118
-
119
-
120
-
121
-
122
-
123
-
124
-
125
-
126
-
127
-
128
-
129
-
130
-
131
-
132
-
133
-
134
-
135
-
136
-
137
-
138
-
139
-
140
-
141
-
142
-
143
-
144
-
145
-
146
-
147
-
148
-
149
-
150
-
151
-
152
-
153
-
154
-
155
-
156
-
157
-
158
-
159
-
160
-
161
-
162
-
163
-
164
-
165
-
166
-
167
-
168
-
169
-
170
-
171
-
172
-
173
-
174
-
175
-
176
-
177
-
178
-
179
-
180
-
181
-
182
-
183
-
184
-
185
-
186
-
187
-
188
-
189
-
190
-
191
-
192
-
193
-
194
-
195
-
196
-
197
-
198
-
199
-
200
-
201
-
202
-
203
-
204
-
205
-
206
-
207
-
208
-
209
-
210
-
211
-
212
-
213
-
214
-
215
-
216
-
217
-
218
-
219
-
220
-
221
-
222
-
223
-
224
-
225
-
226
-
227
-
228
-
229
-
230
-
231
-
232
-
233
-
234
-
235
-
236
-
237
-
238
-
239
-
240
-
241
-
242
-
243
-
244
-
245
-
246
-
247
-
248
-
249
-
250
-
251
-
252
-
253
-
254
-
255
-
256
-
257
-
258
-
259
-
260
-
261
-
262
-
263
-
264
-
265
-
266
-
267
-
268
-
269
-
270
-
271
-
272
-
273
-
274
-
275
-
276
-
277
-
278
-
279
-
280
-
281
-
282
-
283
-
284
-
285
-
286
-
287
-
288
-
289
-
290
-
291
-
292
-
293
-
294
-
295
-
296
-
297
-
298
-
299
-
300
-
301
-
302
-
303
-
304
-
305
-
306
-
307
-
308
-
309
-
310
-
311
-
312
-
313
-
314
-
315
-
316
-
317
-
318
-
319
-
320
-
321
-
322
-
323
-
324
-
325
-
326
-
327
 |
 |

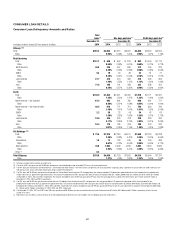
83
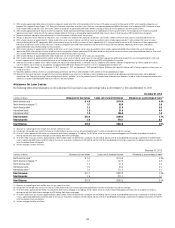
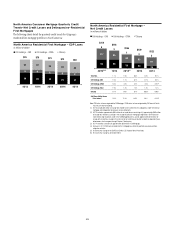
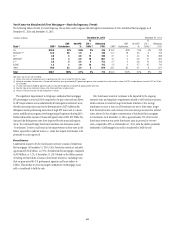
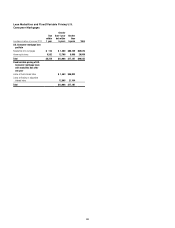
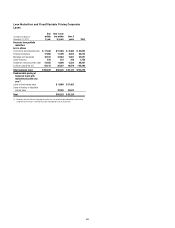
North America Residential First Mortgages—State Delinquency Trends
The following tables set forth, for total Citigroup, the six states and/or regions with the highest concentration of Citi’s residential first mortgages as of
December 31, 2014 and December 31, 2013.
In billions of dollars December 31, 2014 December 31, 2013
State (1) ENR (2)
ENR
Distribution
90+DPD
%
%
LTV >
100% (3)
Refreshed
FICO ENR (2)
ENR
Distribution
90+DPD
%
%
LTV >
100% (3)
Refreshed
FICO
CA $18.9 31% 0.6% 2% 745 $19.2 30% 1.0% 4% 738
NY/NJ/CT (4)(5) 12.2 20 1.9 2 740 11.7 18 2.6 3 733
FL (4) 2.8 5 3.0 14 700 3.1 5 4.4 25 688
IN/OH/MI (4) 2.5 4 2.9 10 667 3.1 5 3.9 21 659
IL (4) 2.5 4 2.5 9 713 2.7 4 3.8 16 703
AZ/NV 1.3 2 1.9 18 715 1.5 2 2.7 25 710
Other 19.9 33 3.4 5 679 23.1 36 4.1 8 671
Total $60.1 100% 2.1% 4% 715 $64.4 100% 2.9% 8% 705
Note: Totals may not sum due to rounding.
(1) Certain of the states are included as part of a region based on Citi’s view of similar HPI within the region.
(2) Ending net receivables. Excludes loans in Canada and Puerto Rico, loans guaranteed by U.S. government agencies, loans recorded at fair value and loans subject to LTSCs. Excludes balances for which FICO or LTV data
are unavailable.
(3) LTV ratios (loan balance divided by appraised value) are calculated at origination and updated by applying market price data.
(4) New York, New Jersey, Connecticut, Indiana, Ohio, Florida and Illinois are judicial states.
(5) Increase in ENR year-over-year was due to originations in Citicorp.
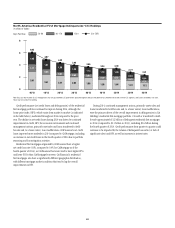
The significant improvement in Citigroup’s residential first mortgages
LTV percentages at year-end 2014 compared to the prior year end was driven
by HPI improvements across substantially all metropolitan statistical areas,
thereby increasing values used in the determination of LTV. Additionally,
delinquent and re-performing asset sales of high LTV loans and, to a lesser
extent, modification programs involving principal forgiveness during 2014
further reduced the amount of loans with greater than 100% LTV. While 90+
days past due delinquency rates have improved for the states and regions
above, the continued longer foreclosure timelines (see discussion under
“Foreclosures” below) could result in less improvement in these rates in the
future, especially in judicial states (i.e., states that require foreclosures to be
processed via court approval).
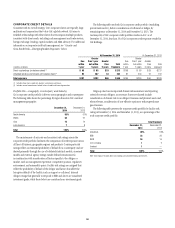
Foreclosures
A substantial majority of Citi’s foreclosure inventory consists of residential
first mortgages. At December 31, 2014, Citi’s foreclosure inventory included
approximately $0.6 billion, or 0.9%, of residential first mortgages, compared
to $0.8 billion, or 1.2%, at December 31, 2013 (based on the dollar amount
of ending net receivables of loans in foreclosure inventory, excluding loans
that are guaranteed by U.S. government agencies and loans subject to
LTSCs). This decline in 2014 was largely attributed to CitiMortgage loans
sold or transferred to held-for-sale.
Citi’s foreclosure inventory continues to be impacted by the ongoing
extensive state and regulatory requirements related to the foreclosure process,
which continue to result in longer foreclosure timelines. Citi’s average
timeframes to move a loan out of foreclosure are two to three times longer
than historical norms, and continue to be even more pronounced in judicial
states, where Citi has a higher concentration of residential first mortgages
in foreclosure. As of December 31, 2014, approximately 21% of Citi’s total
foreclosure inventory was active foreclosure units in process for over two
years, compared to 29% as of December 31, 2013, with the decline primarily
attributed to CitiMortgage loans sold or transferred to held-for-sale.