Citibank 2014 Annual Report Download - page 233
Download and view the complete annual report
Please find page 233 of the 2014 Citibank annual report below. You can navigate through the pages in the report by either clicking on the pages listed below, or by using the keyword search tool below to find specific information within the annual report.-
 1
1 -
2
-
3
-
4
-
5
-
6
-
7
-
8
-
9
-
10
-
11
-
12
-
13
-
14
-
15
-
16
-
17
-
18
-
19
-
20
-
21
-
22
-
23
-
24
-
25
-
26
-
27
-
28
-
29
-
30
-
31
-
32
-
33
-
34
-
35
-
36
-
37
-
38
-
39
-
40
-
41
-
42
-
43
-
44
-
45
-
46
-
47
-
48
-
49
-
50
-
51
-
52
-
53
-
54
-
55
-
56
-
57
-
58
-
59
-
60
-
61
-
62
-
63
-
64
-
65
-
66
-
67
-
68
-
69
-
70
-
71
-
72
-
73
-
74
-
75
-
76
-
77
-
78
-
79
-
80
-
81
-
82
-
83
-
84
-
85
-
86
-
87
-
88
-
89
-
90
-
91
-
92
-
93
-
94
-
95
-
96
-
97
-
98
-
99
-
100
-
101
-
102
-
103
-
104
-
105
-
106
-
107
-
108
-
109
-
110
-
111
-
112
-
113
-
114
-
115
-
116
-
117
-
118
-
119
-
120
-
121
-
122
-
123
-
124
-
125
-
126
-
127
-
128
-
129
-
130
-
131
-
132
-
133
-
134
-
135
-
136
-
137
-
138
-
139
-
140
-
141
-
142
-
143
-
144
-
145
-
146
-
147
-
148
-
149
-
150
-
151
-
152
-
153
-
154
-
155
-
156
-
157
-
158
-
159
-
160
-
161
-
162
-
163
-
164
-
165
-
166
-
167
-
168
-
169
-
170
-
171
-
172
-
173
-
174
-
175
-
176
-
177
-
178
-
179
-
180
-
181
-
182
-
183
-
184
-
185
-
186
-
187
-
188
-
189
-
190
-
191
-
192
-
193
-
194
-
195
-
196
-
197
-
198
-
199
-
200
-
201
-
202
-
203
-
204
-
205
-
206
-
207
-
208
-
209
-
210
-
211
-
212
-
213
-
214
-
215
-
216
-
217
-
218
-
219
-
220
-
221
-
222
-
 223
223 -
 224
224 -
 225
225 -
 226
226 -
 227
227 -
 228
228 -
 229
229 -
 230
230 -
 231
231 -
 232
232 -
 233
233 -
 234
234 -
 235
235 -
 236
236 -
 237
237 -
 238
238 -
 239
239 -
 240
240 -
 241
241 -
 242
242 -
 243
243 -
244
-
245
-
246
-
247
-
248
-
249
-
250
-
251
-
252
-
253
-
254
-
255
-
256
-
257
-
258
-
259
-
260
-
261
-
262
-
263
-
264
-
265
-
266
-
267
-
268
-
269
-
270
-
271
-
272
-
273
-
274
-
275
-
276
-
277
-
278
-
279
-
280
-
281
-
282
-
283
-
284
-
285
-
286
-
287
-
288
-
289
-
290
-
291
-
292
-
293
-
294
-
295
-
296
-
297
-
298
-
299
-
300
-
301
-
302
-
303
-
304
-
305
-
306
-
307
-
308
-
309
-
310
-
311
-
312
-
313
-
314
-
315
-
316
-
317
-
318
-
319
-
320
-
321
-
322
-
323
-
324
-
325
-
326
-
327
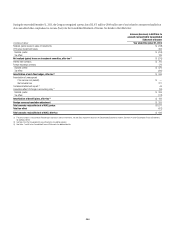
 |
 |

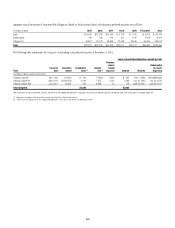
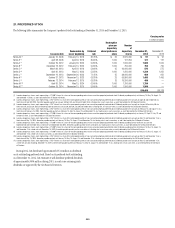
216
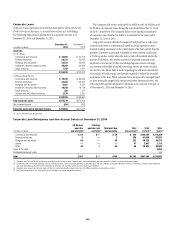
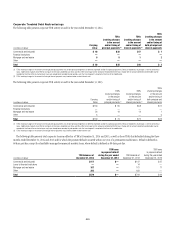
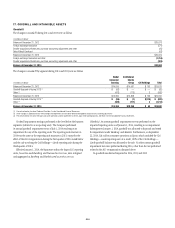
Intangible Assets
The components of intangible assets as of December 31, 2014 and December 31, 2013 were as follows:
December 31, 2014 December 31, 2013
In millions of dollars
Gross
carrying
amount
Accumulated
amortization
Net
carrying
amount
Gross
carrying
amount
Accumulated
amortization
Net
carrying
amount
Purchased credit card relationships $ 7,626 $ 6,294 $1,332 $ 7,552 $ 6,006 $1,546
Core deposit intangibles 1,153 1,021 132 1,255 1,052 203
Other customer relationships 579 331 248 675 389 286
Present value of future profits 233 154 79 238 146 92
Indefinite-lived intangible assets 290 — 290 323 — 323
Other (1) 5,217 2,732 2,485 5,073 2,467 2,606
Intangible assets (excluding MSRs) $15,098 $10,532 $4,566 $15,116 $10,060 $5,056
Mortgage servicing rights (MSRs) (2) 1,845 — 1,845 2,718 — 2,718
Total intangible assets $16,943 $10,532 $6,411 $17,834 $10,060 $7,774
(1) Includes contract-related intangible assets.
(2) For additional information on Citi’s MSRs, including the roll-forward from 2013 to 2014, see Note 22 to the Consolidated Financial Statements.
Intangible assets amortization expense was $756 million, $808 million
and $856 million for 2014, 2013 and 2012, respectively. Intangible assets
amortization expense is estimated to be $659 million in 2015, $634 million
in 2016, $938 million in 2017, $411 million in 2018 and $368 million
in 2019.
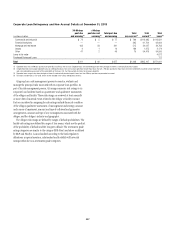
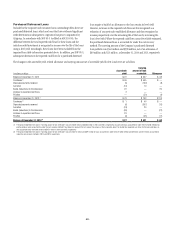
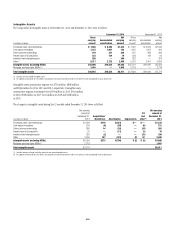
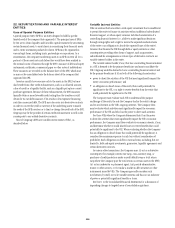
The changes in intangible assets during the 12 months ended December 31, 2014 were as follows:
In millions of dollars
Net carrying
amount at
December 31,
2013
Acquisitions/
divestitures Amortization Impairments
FX
and
other (1)
Net carrying
amount at
December 31,
2014
Purchased credit card relationships $1,546 $110 $(324) $— $ — $1,332
Core deposit intangibles 203 (6) (59) — (6) 132
Other customer relationships 286 14 (28) — (24) 248
Present value of future profits 92 — (12) — (1) 79
Indefinite-lived intangible assets 323 (2) — — (31) 290
Other 2,606 157 (333) (2) 57 2,485
Intangible assets (excluding MSRs) $5,056 $273 $(756) $ (2) $ (5) $4,566
Mortgage servicing rights (MSRs) (2) 2,718 1,845
Total intangible assets $7,774 $6,411
(1) Includes foreign exchange translation and purchase accounting adjustments.
(2) For additional information on Citi’s MSRs, including the roll-forward from 2013 to 2014, see Note 22 to the Consolidated Financial Statements.