Citibank 2014 Annual Report Download - page 54
Download and view the complete annual report
Please find page 54 of the 2014 Citibank annual report below. You can navigate through the pages in the report by either clicking on the pages listed below, or by using the keyword search tool below to find specific information within the annual report.-
 1
1 -
2
-
3
-
4
-
5
-
6
-
7
-
8
-
9
-
10
-
11
-
12
-
13
-
14
-
15
-
16
-
17
-
18
-
19
-
20
-
21
-
22
-
23
-
24
-
25
-
26
-
27
-
28
-
29
-
30
-
31
-
32
-
33
-
34
-
35
-
36
-
37
-
38
-
39
-
40
-
41
-
42
-
43
-
 44
44 -
 45
45 -
 46
46 -
 47
47 -
 48
48 -
 49
49 -
 50
50 -
 51
51 -
 52
52 -
 53
53 -
 54
54 -
 55
55 -
 56
56 -
 57
57 -
 58
58 -
 59
59 -
 60
60 -
 61
61 -
 62
62 -
 63
63 -
 64
64 -
65
-
66
-
67
-
68
-
69
-
70
-
71
-
72
-
73
-
74
-
75
-
76
-
77
-
78
-
79
-
80
-
81
-
82
-
83
-
84
-
85
-
86
-
87
-
88
-
89
-
90
-
91
-
92
-
93
-
94
-
95
-
96
-
97
-
98
-
99
-
100
-
101
-
102
-
103
-
104
-
105
-
106
-
107
-
108
-
109
-
110
-
111
-
112
-
113
-
114
-
115
-
116
-
117
-
118
-
119
-
120
-
121
-
122
-
123
-
124
-
125
-
126
-
127
-
128
-
129
-
130
-
131
-
132
-
133
-
134
-
135
-
136
-
137
-
138
-
139
-
140
-
141
-
142
-
143
-
144
-
145
-
146
-
147
-
148
-
149
-
150
-
151
-
152
-
153
-
154
-
155
-
156
-
157
-
158
-
159
-
160
-
161
-
162
-
163
-
164
-
165
-
166
-
167
-
168
-
169
-
170
-
171
-
172
-
173
-
174
-
175
-
176
-
177
-
178
-
179
-
180
-
181
-
182
-
183
-
184
-
185
-
186
-
187
-
188
-
189
-
190
-
191
-
192
-
193
-
194
-
195
-
196
-
197
-
198
-
199
-
200
-
201
-
202
-
203
-
204
-
205
-
206
-
207
-
208
-
209
-
210
-
211
-
212
-
213
-
214
-
215
-
216
-
217
-
218
-
219
-
220
-
221
-
222
-
223
-
224
-
225
-
226
-
227
-
228
-
229
-
230
-
231
-
232
-
233
-
234
-
235
-
236
-
237
-
238
-
239
-
240
-
241
-
242
-
243
-
244
-
245
-
246
-
247
-
248
-
249
-
250
-
251
-
252
-
253
-
254
-
255
-
256
-
257
-
258
-
259
-
260
-
261
-
262
-
263
-
264
-
265
-
266
-
267
-
268
-
269
-
270
-
271
-
272
-
273
-
274
-
275
-
276
-
277
-
278
-
279
-
280
-
281
-
282
-
283
-
284
-
285
-
286
-
287
-
288
-
289
-
290
-
291
-
292
-
293
-
294
-
295
-
296
-
297
-
298
-
299
-
300
-
301
-
302
-
303
-
304
-
305
-
306
-
307
-
308
-
309
-
310
-
311
-
312
-
313
-
314
-
315
-
316
-
317
-
318
-
319
-
320
-
321
-
322
-
323
-
324
-
325
-
326
-
327
 |
 |
37
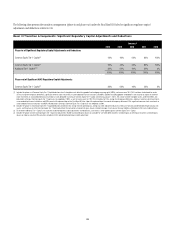
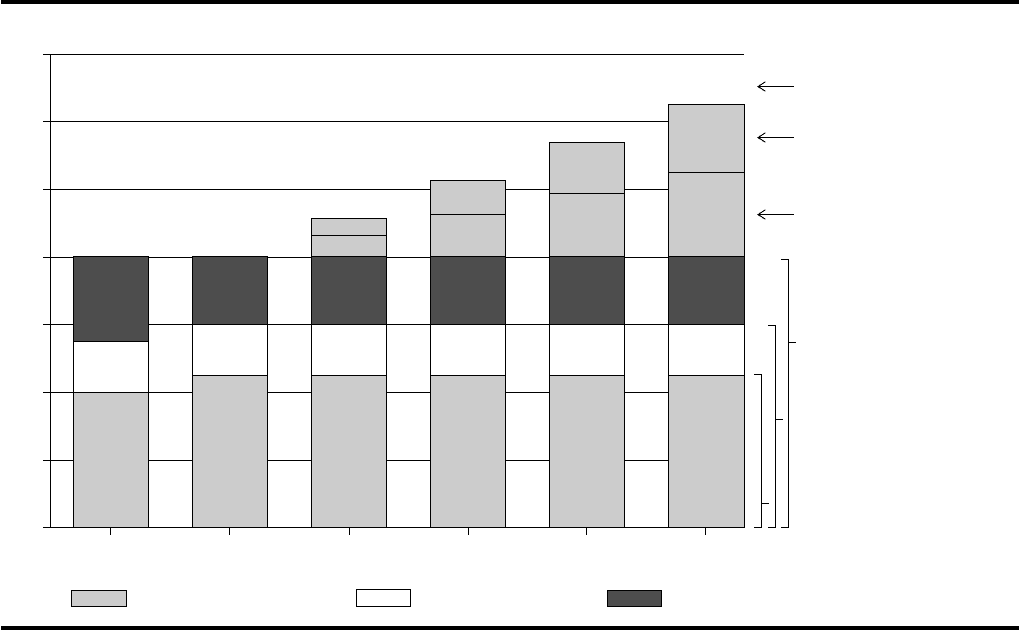
Basel III Transition Arrangements
The Final Basel III Rules contain several differing, largely multi-year
transition provisions (i.e., “phase-ins” and “phase-outs”) with respect to
the stated minimum Common Equity Tier 1 Capital and Tier 1 Capital
ratio requirements, substantially all regulatory capital adjustments and
deductions, non-qualifying Tier 1 and Tier 2 Capital instruments (such
as non-grandfathered trust preferred securities and certain subordinated
debt issuances), and the capital buffers. All of these transition provisions,
with the exception of the phase-out of non-qualifying trust preferred
securities from Tier 2 Capital, will be fully implemented by January 1, 2019
(full implementation).
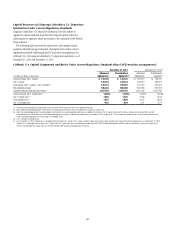
The following chart sets forth the transitional progression to full
implementation by January 1, 2019 of the regulatory capital components
(i.e., inclusive of the mandatory 2.5% Capital Conservation Buffer and at
least a 2% global systemically important bank holding company (GSIB)
surcharge, but exclusive of the potential imposition of an additional
Countercyclical Capital Buffer) comprising the effective minimum risk-based
capital ratios.
0%
2%
4%
6%
8%
10%
12%
14%
1/1/191/1/181/1/171/1/161/1/151/1/14
Basel III Transition Arrangements: Minimum Risk-Based Capital Ratios
Tier 2 CapitalAdditional Tier 1 CapitalCommon Equity Tier 1 Capital
4%
1.5%
2.5%
4.5%
1.5%
2%
4.5%
1.5%
0.625%
0.5%
9.125%
10.25%
11.375%
12.5%
1.25%
1%
1.875%
1.5%
2.5%
2%
2%
4.5%
1.5%
2%
4.5%
1.5%
2%
4.5%
1.5%
2%
Total Capital ratio
(effective minimum)
Capital Conservation
Buffer
8% Total Capital ratio
(stated minimum)
6% Tier 1 Capital ratio
(stated minimum)
4.5% Common Equity
Tier 1 Capital ratio
(stated minimum)
GSIB surcharge(1)
(1) The Final Basel III Rules do not address GSIBs. The transitional progression reflected in the chart above is consistent with the phase-in arrangement under the Basel Committee on Banking Supervision’s (Basel
Committee) GSIB rules, which would subject Citi to at least a 2% GSIB surcharge. In December 2014, however, the Federal Reserve Board issued a notice of proposed rulemaking which would impose risk-based
capital surcharges upon U.S. bank holding companies that are identified as GSIBs, including Citi. As of December 31, 2014, Citi estimates its GSIB surcharge under the Federal Reserve Board’s proposal would be 4%,
compared to at least 2% under the Basel Committee requirements. For additional information regarding the Federal Reserve Board’s proposed rule, see “Regulatory Capital Standards Developments” below.