Citibank 2014 Annual Report Download - page 185
Download and view the complete annual report
Please find page 185 of the 2014 Citibank annual report below. You can navigate through the pages in the report by either clicking on the pages listed below, or by using the keyword search tool below to find specific information within the annual report.-
 1
1 -
2
-
3
-
4
-
5
-
6
-
7
-
8
-
9
-
10
-
11
-
12
-
13
-
14
-
15
-
16
-
17
-
18
-
19
-
20
-
21
-
22
-
23
-
24
-
25
-
26
-
27
-
28
-
29
-
30
-
31
-
32
-
33
-
34
-
35
-
36
-
37
-
38
-
39
-
40
-
41
-
42
-
43
-
44
-
45
-
46
-
47
-
48
-
49
-
50
-
51
-
52
-
53
-
54
-
55
-
56
-
57
-
58
-
59
-
60
-
61
-
62
-
63
-
64
-
65
-
66
-
67
-
68
-
69
-
70
-
71
-
72
-
73
-
74
-
75
-
76
-
77
-
78
-
79
-
80
-
81
-
82
-
83
-
84
-
85
-
86
-
87
-
88
-
89
-
90
-
91
-
92
-
93
-
94
-
95
-
96
-
97
-
98
-
99
-
100
-
101
-
102
-
103
-
104
-
105
-
106
-
107
-
108
-
109
-
110
-
111
-
112
-
113
-
114
-
115
-
116
-
117
-
118
-
119
-
120
-
121
-
122
-
123
-
124
-
125
-
126
-
127
-
128
-
129
-
130
-
131
-
132
-
133
-
134
-
135
-
136
-
137
-
138
-
139
-
140
-
141
-
142
-
143
-
144
-
145
-
146
-
147
-
148
-
149
-
150
-
151
-
152
-
153
-
154
-
155
-
156
-
157
-
158
-
159
-
160
-
161
-
162
-
163
-
164
-
165
-
166
-
167
-
168
-
169
-
170
-
171
-
172
-
173
-
174
-
 175
175 -
 176
176 -
 177
177 -
 178
178 -
 179
179 -
 180
180 -
 181
181 -
 182
182 -
 183
183 -
 184
184 -
 185
185 -
 186
186 -
 187
187 -
 188
188 -
 189
189 -
 190
190 -
 191
191 -
 192
192 -
 193
193 -
 194
194 -
 195
195 -
196
-
197
-
198
-
199
-
200
-
201
-
202
-
203
-
204
-
205
-
206
-
207
-
208
-
209
-
210
-
211
-
212
-
213
-
214
-
215
-
216
-
217
-
218
-
219
-
220
-
221
-
222
-
223
-
224
-
225
-
226
-
227
-
228
-
229
-
230
-
231
-
232
-
233
-
234
-
235
-
236
-
237
-
238
-
239
-
240
-
241
-
242
-
243
-
244
-
245
-
246
-
247
-
248
-
249
-
250
-
251
-
252
-
253
-
254
-
255
-
256
-
257
-
258
-
259
-
260
-
261
-
262
-
263
-
264
-
265
-
266
-
267
-
268
-
269
-
270
-
271
-
272
-
273
-
274
-
275
-
276
-
277
-
278
-
279
-
280
-
281
-
282
-
283
-
284
-
285
-
286
-
287
-
288
-
289
-
290
-
291
-
292
-
293
-
294
-
295
-
296
-
297
-
298
-
299
-
300
-
301
-
302
-
303
-
304
-
305
-
306
-
307
-
308
-
309
-
310
-
311
-
312
-
313
-
314
-
315
-
316
-
317
-
318
-
319
-
320
-
321
-
322
-
323
-
324
-
325
-
326
-
327
 |
 |

168
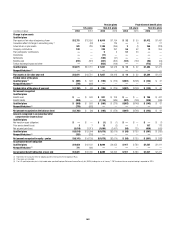
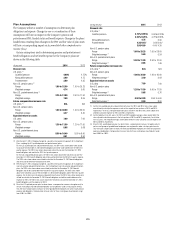
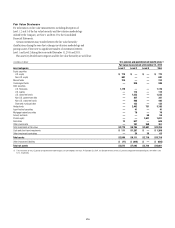
Pension plans Postretirement benefit plans
U.S. plans Non-U.S. plans U.S. plans Non-U.S. plans
In millions of dollars 2014 2013 2014 2013 2014 2013 2014 2013
Change in plan assets
Qualified plans
Plan assets at fair value at beginning of year $12,731 $12,656 $ 6,918 $ 7,154 $ 32 $ 50 $1,472 $1,497
Cumulative effect of change in accounting policy (1) —(53) —126 —3—21
Actual return on plan assets 941 789 1,108 (256) 2(1) 166 (223)
Company contributions 100 —230 357 56 52 12 256
Plan participants’ contributions ——5651 50 ——
Divestitures ——(11) —————
Settlements ——(184) (61) ————
Benefits paid (701) (661) (357) (302) (131) (122) (93) (64)
Foreign exchange impact and other ——(652) (106) ——(173) (15)
Qualified plans $13,071 $12,731 $ 7,057 $ 6,918 $ 10 $ 32 $1,384 $1,472
Nonqualified plans (2) ————————
Plan assets at fair value year end $13,071 $12,731 $ 7,057 $ 6,918 $ 10 $ 32 $1,384 $1,472
Funded status of the plans
Qualified plans (3) $ (989) $ 593 $ (195) $ (276) $(907) $(748) $ (143) $ 61
Nonqualified plans (2) (779) (692) ——————
Funded status of the plans at year end $ (1,768) $ (99) $ (195) $ (276) $(907) $(748) $ (143) $ 61
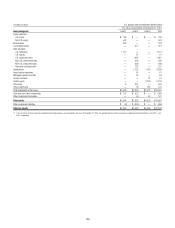
Net amount recognized
Qualified plans
Benefit asset $ — $ 593 $ 921 $ 709 $ — $ — $ 196 $ 407
Benefit liability (989) —(1,116) (985) (907) (748) (339) (346)
Qualified plans $ (989) $ 593 $ (195) $ (276) $(907) $(748) $ (143) $ 61
Nonqualified plans (2) (779) (692) ——————
Net amount recognized on the balance sheet $ (1,768) $ (99) $ (195) $ (276) $(907) $(748) $ (143) $ 61
Amounts recognized in Accumulated other
comprehensive income (loss)
Qualified plans
Net transition asset (obligation) $ — $ — $ (1) $ (1) $ — $ — $ — $ (1)
Prior service benefit (cost) 3713 (2) —1157 173
Net actuarial gain (loss) (5,819) (3,911) (1,690) (2,007) (56) 129 (658) (555)
Qualified plans $ (5,816) $ (3,904) $(1,678) $(2,010) $ (56) $ 130 $ (501) $ (383)
Nonqualified plans (2) (325) (226) ——————
Net amount recognized in equity - pretax $ (6,141) $ (4,130) $(1,678) $(2,010) $ (56) $ 130 $ (501) $ (383)
Accumulated benefit obligation
Qualified plans $14,050 $12,122 $ 6,699 $ 6,652 $ 917 $ 780 $1,527 $1,411
Nonqualified plans (2) 771 668 ——————
Accumulated benefit obligation at year end $14,821 $12,790 $ 6,699 $ 6,652 $ 917 $ 780 $1,527 $1,411
(1) Represents the cumulative effect of adopting quarterly remeasurement for Significant Plans.
(2) These plans are unfunded.
(3) The U.S. qualified pension plan is fully funded under specified Employee Retirement Income Security Act (ERISA) funding rules as of January 1, 2015 and no minimum required funding is expected for 2015.