Citibank 2014 Annual Report Download - page 280
Download and view the complete annual report
Please find page 280 of the 2014 Citibank annual report below. You can navigate through the pages in the report by either clicking on the pages listed below, or by using the keyword search tool below to find specific information within the annual report.-
 1
1 -
2
-
3
-
4
-
5
-
6
-
7
-
8
-
9
-
10
-
11
-
12
-
13
-
14
-
15
-
16
-
17
-
18
-
19
-
20
-
21
-
22
-
23
-
24
-
25
-
26
-
27
-
28
-
29
-
30
-
31
-
32
-
33
-
34
-
35
-
36
-
37
-
38
-
39
-
40
-
41
-
42
-
43
-
44
-
45
-
46
-
47
-
48
-
49
-
50
-
51
-
52
-
53
-
54
-
55
-
56
-
57
-
58
-
59
-
60
-
61
-
62
-
63
-
64
-
65
-
66
-
67
-
68
-
69
-
70
-
71
-
72
-
73
-
74
-
75
-
76
-
77
-
78
-
79
-
80
-
81
-
82
-
83
-
84
-
85
-
86
-
87
-
88
-
89
-
90
-
91
-
92
-
93
-
94
-
95
-
96
-
97
-
98
-
99
-
100
-
101
-
102
-
103
-
104
-
105
-
106
-
107
-
108
-
109
-
110
-
111
-
112
-
113
-
114
-
115
-
116
-
117
-
118
-
119
-
120
-
121
-
122
-
123
-
124
-
125
-
126
-
127
-
128
-
129
-
130
-
131
-
132
-
133
-
134
-
135
-
136
-
137
-
138
-
139
-
140
-
141
-
142
-
143
-
144
-
145
-
146
-
147
-
148
-
149
-
150
-
151
-
152
-
153
-
154
-
155
-
156
-
157
-
158
-
159
-
160
-
161
-
162
-
163
-
164
-
165
-
166
-
167
-
168
-
169
-
170
-
171
-
172
-
173
-
174
-
175
-
176
-
177
-
178
-
179
-
180
-
181
-
182
-
183
-
184
-
185
-
186
-
187
-
188
-
189
-
190
-
191
-
192
-
193
-
194
-
195
-
196
-
197
-
198
-
199
-
200
-
201
-
202
-
203
-
204
-
205
-
206
-
207
-
208
-
209
-
210
-
211
-
212
-
213
-
214
-
215
-
216
-
217
-
218
-
219
-
220
-
221
-
222
-
223
-
224
-
225
-
226
-
227
-
228
-
229
-
230
-
231
-
232
-
233
-
234
-
235
-
236
-
237
-
238
-
239
-
240
-
241
-
242
-
243
-
244
-
245
-
246
-
247
-
248
-
249
-
250
-
251
-
252
-
253
-
254
-
255
-
256
-
257
-
258
-
259
-
260
-
261
-
262
-
263
-
264
-
265
-
266
-
267
-
268
-
269
-
 270
270 -
 271
271 -
 272
272 -
 273
273 -
 274
274 -
 275
275 -
 276
276 -
 277
277 -
 278
278 -
 279
279 -
 280
280 -
 281
281 -
 282
282 -
 283
283 -
 284
284 -
 285
285 -
 286
286 -
 287
287 -
 288
288 -
 289
289 -
 290
290 -
291
-
292
-
293
-
294
-
295
-
296
-
297
-
298
-
299
-
300
-
301
-
302
-
303
-
304
-
305
-
306
-
307
-
308
-
309
-
310
-
311
-
312
-
313
-
314
-
315
-
316
-
317
-
318
-
319
-
320
-
321
-
322
-
323
-
324
-
325
-
326
-
327
 |
 |

263
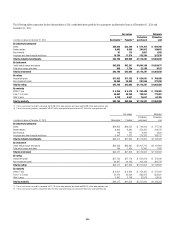
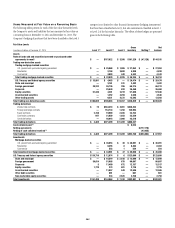
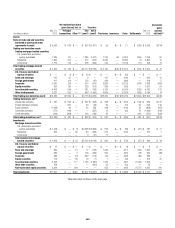
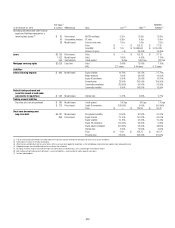
In millions of dollars at December 31, 2014 Level 1 (1) Level 2 (1) Level 3
Gross
inventory Netting (2)
Net
balance
Loans (4) $ — $ 2,793 $ 3,108 $ 5,901 $ — $ 5,901
Mortgage servicing rights — — 1,845 1,845 — 1,845
Non-trading derivatives and other financial assets measured
on a recurring basis, gross $ — $ 9,352 $ 78 $ 9,430
Cash collateral paid (5) 123
Netting of cash collateral received (8) $ (1,791)
Non-trading derivatives and other financial assets measured
on a recurring basis $ — $ 9,352 $ 78 $ 9,553 $ (1,791) $ 7,762
Total assets $261,637 $1,322,433 $42,393 $1,633,109 $(873,723) $759,386
Total as a percentage of gross assets (6) 16.1% 81.3% 2.6%
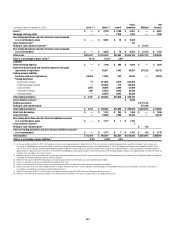
Liabilities
Interest-bearing deposits $ — $ 1,198 $ 486 $ 1,684 $ — $ 1,684
Federal funds purchased and securities loaned or sold under
agreements to repurchase — 82,811 1,043 83,854 (47,129) 36,725
Trading account liabilities
Securities sold, not yet purchased 59,463 11,057 424 70,944 — 70,944
Trading derivatives
Interest rate contracts 77 617,933 4,272 622,282
Foreign exchange contracts — 158,354 472 158,826
Equity contracts 2,955 26,616 2,898 32,469
Commodity contracts 669 22,872 2,645 26,186
Credit derivatives — 39,787 3,643 43,430
Total trading derivatives $ 3,701 $ 865,562 $13,930 $ 883,193
Cash collateral received (7) $ 9,846
Netting agreements $(777,178)
Netting of cash collateral paid (47,769)
Total trading derivatives $ 3,701 $ 865,562 $13,930 $ 893,039 $ (824,947) $ 68,092
Short-term borrowings $ — $ 1,152 $ 344 $ 1,496 $ — $ 1,496
Long-term debt — 18,890 7,290 26,180 — 26,180
Non-trading derivatives and other financial liabilities measured
on a recurring basis, gross $ — $ 1,777 $ 7 $ 1,784
Cash collateral received (8) 7
Netting of cash collateral paid (5) $ (15)
Total non-trading derivatives and other financial liabilities measured
on a recurring basis $ — $ 1,777 $ 7 $ 1,791 $ (15) $ 1,776
Total liabilities $ 63,164 $ 982,447 $23,524 $1,078,988 $(872,091) $206,897
Total as a percentage of gross liabilities (6) 5.9% 91.9% 2.2%
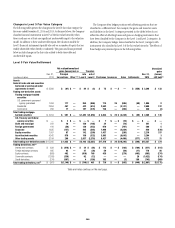
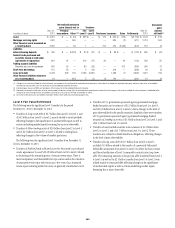
(1) For the year ended December 31, 2014, the Company transferred assets of approximately $4.1 billion from Level 1 to Level 2, primarily related to foreign government securities not traded in active markets and
Citi refining its methodology for certain equity contracts to reflect the prevalence of off-exchange trading. During the year ended December 31, 2014, the Company transferred assets of approximately $4.2 billion
from Level 2 to Level 1, primarily related to foreign government bonds traded with sufficient frequency to constitute a liquid market. During the year ended December 31, 2014, the Company transferred liabilities of
approximately $1.4 billion from Level 1 to Level 2, as Citi refined its methodology for certain equity contracts to reflect the prevalence of off-exchange trading. During the year ended December 31, 2014, there were no
material transfers of liabilities from Level 2 to Level 1.
(2) Represents netting of: (i) the amounts due under securities purchased under agreements to resell and the amounts owed under securities sold under agreements to repurchase; and (ii) derivative exposures covered by
a qualifying master netting agreement and cash collateral offsetting.
(3) Reflects the net amount of $54,292 million of gross cash collateral paid, of which $47,769 million was used to offset derivative liabilities.
(4) There is no allowance for loan losses recorded for loans reported at fair value.
(5) Reflects the net amount of $138 million of gross cash collateral paid, of which $15 million was used to offset non-trading derivative liabilities.
(6) Because the amount of the cash collateral paid/received has not been allocated to the Level 1, 2 and 3 subtotals, these percentages are calculated based on total assets and liabilities measured at fair value on a
recurring basis, excluding the cash collateral paid/received on derivatives.
(7) Reflects the net amount of $57,471 million of gross cash collateral received, of which $47,625 million was used to offset derivative assets.
(8) Reflects the net amount of $1,798 million of gross cash collateral received, of which $1,791 million was used to offset non-trading derivative assets.