Citibank 2014 Annual Report Download - page 285
Download and view the complete annual report
Please find page 285 of the 2014 Citibank annual report below. You can navigate through the pages in the report by either clicking on the pages listed below, or by using the keyword search tool below to find specific information within the annual report.-
 1
1 -
2
-
3
-
4
-
5
-
6
-
7
-
8
-
9
-
10
-
11
-
12
-
13
-
14
-
15
-
16
-
17
-
18
-
19
-
20
-
21
-
22
-
23
-
24
-
25
-
26
-
27
-
28
-
29
-
30
-
31
-
32
-
33
-
34
-
35
-
36
-
37
-
38
-
39
-
40
-
41
-
42
-
43
-
44
-
45
-
46
-
47
-
48
-
49
-
50
-
51
-
52
-
53
-
54
-
55
-
56
-
57
-
58
-
59
-
60
-
61
-
62
-
63
-
64
-
65
-
66
-
67
-
68
-
69
-
70
-
71
-
72
-
73
-
74
-
75
-
76
-
77
-
78
-
79
-
80
-
81
-
82
-
83
-
84
-
85
-
86
-
87
-
88
-
89
-
90
-
91
-
92
-
93
-
94
-
95
-
96
-
97
-
98
-
99
-
100
-
101
-
102
-
103
-
104
-
105
-
106
-
107
-
108
-
109
-
110
-
111
-
112
-
113
-
114
-
115
-
116
-
117
-
118
-
119
-
120
-
121
-
122
-
123
-
124
-
125
-
126
-
127
-
128
-
129
-
130
-
131
-
132
-
133
-
134
-
135
-
136
-
137
-
138
-
139
-
140
-
141
-
142
-
143
-
144
-
145
-
146
-
147
-
148
-
149
-
150
-
151
-
152
-
153
-
154
-
155
-
156
-
157
-
158
-
159
-
160
-
161
-
162
-
163
-
164
-
165
-
166
-
167
-
168
-
169
-
170
-
171
-
172
-
173
-
174
-
175
-
176
-
177
-
178
-
179
-
180
-
181
-
182
-
183
-
184
-
185
-
186
-
187
-
188
-
189
-
190
-
191
-
192
-
193
-
194
-
195
-
196
-
197
-
198
-
199
-
200
-
201
-
202
-
203
-
204
-
205
-
206
-
207
-
208
-
209
-
210
-
211
-
212
-
213
-
214
-
215
-
216
-
217
-
218
-
219
-
220
-
221
-
222
-
223
-
224
-
225
-
226
-
227
-
228
-
229
-
230
-
231
-
232
-
233
-
234
-
235
-
236
-
237
-
238
-
239
-
240
-
241
-
242
-
243
-
244
-
245
-
246
-
247
-
248
-
249
-
250
-
251
-
252
-
253
-
254
-
255
-
256
-
257
-
258
-
259
-
260
-
261
-
262
-
263
-
264
-
265
-
266
-
267
-
268
-
269
-
270
-
271
-
272
-
273
-
274
-
 275
275 -
 276
276 -
 277
277 -
 278
278 -
 279
279 -
 280
280 -
 281
281 -
 282
282 -
 283
283 -
 284
284 -
 285
285 -
 286
286 -
 287
287 -
 288
288 -
 289
289 -
 290
290 -
 291
291 -
 292
292 -
 293
293 -
 294
294 -
 295
295 -
296
-
297
-
298
-
299
-
300
-
301
-
302
-
303
-
304
-
305
-
306
-
307
-
308
-
309
-
310
-
311
-
312
-
313
-
314
-
315
-
316
-
317
-
318
-
319
-
320
-
321
-
322
-
323
-
324
-
325
-
326
-
327
 |
 |

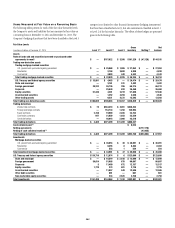
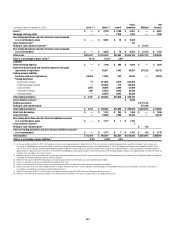
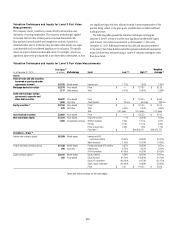
268
In millions of dollars
Dec. 31,
2012
Net realized/unrealized
gains (losses) incl. in Transfers
Purchases Issuances Sales Settlements
Dec. 31,
2013
Unrealized
gains
(losses)
still held (3)
Principal
transactions Other (1)(2)
into
Level 3
out of
Level 3
Assets
Federal funds sold and securities
borrowed or purchased under
agreements to resell $ 5,043 $ (137) $ — $ 627 $(1,871) $ 59 $— $ 71 $ (226) $ 3,566 $(124)
Trading non-derivative assets
Trading mortgage-backed securities
U.S. government-sponsored
agency guaranteed 1,325 141 — 1,386 (1,477) 1,316 68 (1,310) (355) 1,094 52
Residential 1,805 474 — 513 (372) 3,630 — (3,189) (7) 2,854 10
Commercial 1,119 114 — 278 (304) 244 — (1,178) (17) 256 14
Total trading mortgage-backed
securities $ 4,249 $ 729 $ — $ 2,177 $(2,153) $ 5,190 $68 $ (5,677) $ (379) $ 4,204 $ 76
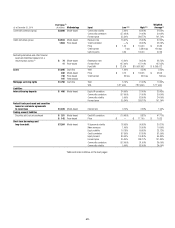
U.S. Treasury and federal
agency securities $ — $ (1) $ — $ 54 $ — $ — $— $ (53) $ — $ — $ —
State and municipal 195 37 — 9 — 107 — (126) — 222 15
Foreign government 311 (21) — 156 (67) 326 — (289) — 416 5
Corporate 2,030 (20) — 410 (410) 2,864 — (2,116) (923) 1,835 (406)
Equity securities 264 129 — 228 (210) 829 — (183) — 1,057 59
Asset-backed securities 4,453 544 — 181 (193) 5,165 — (5,579) (229) 4,342 123
Other trading assets 2,321 202 — 960 (1,592) 3,879 — (2,253) (333) 3,184 (7)
Total trading non-derivative assets $13,823 $1,599 $ — $ 4,175 $(4,625) $18,360 $ 68 $(16,276) $(1,864) $15,260 $ (135)
Trading derivatives, net (4)
Interest rate contracts $ 181 $ 292 $ — $ 692 $ (226) $ 228 $— $ (155) $ (173) $ 839 $ 779
Foreign exchange contracts — 625 — 29 (35) 26 — (10) 60 695 146
Equity contracts (1,448) 96 — 25 295 298 — (149) 25 (858) (453)
Commodity contracts (771) (164) — — (527) 15 — (25) 79 (1,393) (246)
Credit derivatives (342) (368) — 106 (183) 20 — — 493 (274) (544)
Total trading derivatives, net (4) $ (2,380) $ 481 $ — $ 852 $ (676) $ 587 $— $ (339) $ 484 $ (991) $(318)
Investments
Mortgage-backed securities
U.S. government-sponsored
agency guaranteed $ 1,458 $ — $ (7) $ 2,058 $(3,820) $ 593 $— $ (38) $ (57) $ 187 $ 11
Residential 205 — 30 60 (265) 212 — (140) — 102 7
Commercial — — — 4 (21) 17 — — — — —
Total investment mortgage-
backed securities $ 1,663 $ — $ 23 $ 2,122 $ (4,106) $ 822 $— $ (178) $ (57) $ 289 $ 18
U.S. Treasury and federal
agency securities $ 12 $ — $ — $ — $ — $ — $— $ (4) $ — $ 8 $ —
State and municipal 849 — 10 12 (122) 1,236 — (217) (125) 1,643 (75)
Foreign government 383 — 2 178 (256) 506 — (391) (78) 344 (28)
Corporate 385 — (27) 334 (119) 104 — (303) (89) 285 —
Equity securities 773 — 56 19 (1) 1 — (33) — 815 47
Asset-backed securities 2,220 — 117 1,192 (1,684) 1,475 — (337) (1,023) 1,960 —
Other debt securities 258 — — — (205) 50 — (53) — 50 —
Non-marketable equity securities 5,364 — 249 — — 653 — (342) (1,577) 4,347 241
Total investments $11,907 $ — $430 $3,857 $(6,493) $ 4,847 $— $ (1,858) $(2,949) $ 9,741 $ 203
Table and notes continue on the next page.