Citibank 2014 Annual Report Download - page 177
Download and view the complete annual report
Please find page 177 of the 2014 Citibank annual report below. You can navigate through the pages in the report by either clicking on the pages listed below, or by using the keyword search tool below to find specific information within the annual report.-
 1
1 -
2
-
3
-
4
-
5
-
6
-
7
-
8
-
9
-
10
-
11
-
12
-
13
-
14
-
15
-
16
-
17
-
18
-
19
-
20
-
21
-
22
-
23
-
24
-
25
-
26
-
27
-
28
-
29
-
30
-
31
-
32
-
33
-
34
-
35
-
36
-
37
-
38
-
39
-
40
-
41
-
42
-
43
-
44
-
45
-
46
-
47
-
48
-
49
-
50
-
51
-
52
-
53
-
54
-
55
-
56
-
57
-
58
-
59
-
60
-
61
-
62
-
63
-
64
-
65
-
66
-
67
-
68
-
69
-
70
-
71
-
72
-
73
-
74
-
75
-
76
-
77
-
78
-
79
-
80
-
81
-
82
-
83
-
84
-
85
-
86
-
87
-
88
-
89
-
90
-
91
-
92
-
93
-
94
-
95
-
96
-
97
-
98
-
99
-
100
-
101
-
102
-
103
-
104
-
105
-
106
-
107
-
108
-
109
-
110
-
111
-
112
-
113
-
114
-
115
-
116
-
117
-
118
-
119
-
120
-
121
-
122
-
123
-
124
-
125
-
126
-
127
-
128
-
129
-
130
-
131
-
132
-
133
-
134
-
135
-
136
-
137
-
138
-
139
-
140
-
141
-
142
-
143
-
144
-
145
-
146
-
147
-
148
-
149
-
150
-
151
-
152
-
153
-
154
-
155
-
156
-
157
-
158
-
159
-
160
-
161
-
162
-
163
-
164
-
165
-
166
-
 167
167 -
 168
168 -
 169
169 -
 170
170 -
 171
171 -
 172
172 -
 173
173 -
 174
174 -
 175
175 -
 176
176 -
 177
177 -
 178
178 -
 179
179 -
 180
180 -
 181
181 -
 182
182 -
 183
183 -
 184
184 -
 185
185 -
 186
186 -
 187
187 -
188
-
189
-
190
-
191
-
192
-
193
-
194
-
195
-
196
-
197
-
198
-
199
-
200
-
201
-
202
-
203
-
204
-
205
-
206
-
207
-
208
-
209
-
210
-
211
-
212
-
213
-
214
-
215
-
216
-
217
-
218
-
219
-
220
-
221
-
222
-
223
-
224
-
225
-
226
-
227
-
228
-
229
-
230
-
231
-
232
-
233
-
234
-
235
-
236
-
237
-
238
-
239
-
240
-
241
-
242
-
243
-
244
-
245
-
246
-
247
-
248
-
249
-
250
-
251
-
252
-
253
-
254
-
255
-
256
-
257
-
258
-
259
-
260
-
261
-
262
-
263
-
264
-
265
-
266
-
267
-
268
-
269
-
270
-
271
-
272
-
273
-
274
-
275
-
276
-
277
-
278
-
279
-
280
-
281
-
282
-
283
-
284
-
285
-
286
-
287
-
288
-
289
-
290
-
291
-
292
-
293
-
294
-
295
-
296
-
297
-
298
-
299
-
300
-
301
-
302
-
303
-
304
-
305
-
306
-
307
-
308
-
309
-
310
-
311
-
312
-
313
-
314
-
315
-
316
-
317
-
318
-
319
-
320
-
321
-
322
-
323
-
324
-
325
-
326
-
327
 |
 |

160
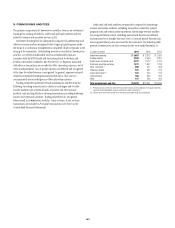
5. COMMISSIONS AND FEES
The primary components of Commissions and fees revenue are investment
banking fees, trading-related fees, credit card and bank card fees and fees
related to treasury and securities services in ICG.
Investment banking fees are substantially composed of underwriting and
advisory revenues and are recognized when Citigroup’s performance under
the terms of a contractual arrangement is completed, which is typically at the
closing of the transaction. Underwriting revenue is recorded in Commissions
and fees, net of both reimbursable and non-reimbursable expenses,
consistent with the AICPA Audit and Accounting Guide for Brokers and
Dealers in Securities (codified in ASC 940-605-05-1). Expenses associated
with advisory transactions are recorded in Other operating expenses, net of
client reimbursements. Out-of-pocket expenses are deferred and recognized
at the time the related revenue is recognized. In general, expenses incurred
related to investment banking transactions that fail to close (are not
consummated) are recorded gross in Other operating expenses.
Trading-related fees primarily include commissions and fees from the
following: executing transactions for clients on exchanges and over-the-
counter markets; sale of mutual funds, insurance and other annuity
products; and assisting clients in clearing transactions, providing brokerage
services and other such activities. Trading-related fees are recognized
when earned in Commissions and fees. Gains or losses, if any, on these
transactions are included in Principal transactions (see Note 6 to the
Consolidated Financial Statements).
Credit card and bank card fees are primarily composed of interchange
revenue and certain card fees, including annual fees, reduced by reward
program costs and certain partner payments. Interchange revenue and fees
are recognized when earned, including annual card fees that are deferred
and amortized on a straight-line basis over a 12-month period. Reward costs
are recognized when points are earned by the customers. The following table
presents Commissions and fees revenue for the years ended December 31:
In millions of dollars 2014 2013 2012
Investment banking $ 3,687 $ 3,315 $ 2,991
Trading-related 2,503 2,563 2,331
Credit cards and bank cards 2,227 2,472 2,775
Trade and securities services 1,871 1,847 1,733
Other consumer (1) 885 911 908
Checking-related 531 551 615
Corporate finance (2) 531 516 516
Loan servicing 380 500 313
Other 417 266 402
Total commissions and fees $13,032 $12,941 $12,584
(1) Primarily consists of fees for investment fund administration and management, third-party collections,
commercial demand deposit accounts and certain credit card services.
(2) Consists primarily of fees earned from structuring and underwriting loan syndications.