Citibank 2014 Annual Report Download - page 201
Download and view the complete annual report
Please find page 201 of the 2014 Citibank annual report below. You can navigate through the pages in the report by either clicking on the pages listed below, or by using the keyword search tool below to find specific information within the annual report.-
 1
1 -
2
-
3
-
4
-
5
-
6
-
7
-
8
-
9
-
10
-
11
-
12
-
13
-
14
-
15
-
16
-
17
-
18
-
19
-
20
-
21
-
22
-
23
-
24
-
25
-
26
-
27
-
28
-
29
-
30
-
31
-
32
-
33
-
34
-
35
-
36
-
37
-
38
-
39
-
40
-
41
-
42
-
43
-
44
-
45
-
46
-
47
-
48
-
49
-
50
-
51
-
52
-
53
-
54
-
55
-
56
-
57
-
58
-
59
-
60
-
61
-
62
-
63
-
64
-
65
-
66
-
67
-
68
-
69
-
70
-
71
-
72
-
73
-
74
-
75
-
76
-
77
-
78
-
79
-
80
-
81
-
82
-
83
-
84
-
85
-
86
-
87
-
88
-
89
-
90
-
91
-
92
-
93
-
94
-
95
-
96
-
97
-
98
-
99
-
100
-
101
-
102
-
103
-
104
-
105
-
106
-
107
-
108
-
109
-
110
-
111
-
112
-
113
-
114
-
115
-
116
-
117
-
118
-
119
-
120
-
121
-
122
-
123
-
124
-
125
-
126
-
127
-
128
-
129
-
130
-
131
-
132
-
133
-
134
-
135
-
136
-
137
-
138
-
139
-
140
-
141
-
142
-
143
-
144
-
145
-
146
-
147
-
148
-
149
-
150
-
151
-
152
-
153
-
154
-
155
-
156
-
157
-
158
-
159
-
160
-
161
-
162
-
163
-
164
-
165
-
166
-
167
-
168
-
169
-
170
-
171
-
172
-
173
-
174
-
175
-
176
-
177
-
178
-
179
-
180
-
181
-
182
-
183
-
184
-
185
-
186
-
187
-
188
-
189
-
190
-
 191
191 -
 192
192 -
 193
193 -
 194
194 -
 195
195 -
 196
196 -
 197
197 -
 198
198 -
 199
199 -
 200
200 -
 201
201 -
 202
202 -
 203
203 -
 204
204 -
 205
205 -
 206
206 -
 207
207 -
 208
208 -
 209
209 -
 210
210 -
 211
211 -
212
-
213
-
214
-
215
-
216
-
217
-
218
-
219
-
220
-
221
-
222
-
223
-
224
-
225
-
226
-
227
-
228
-
229
-
230
-
231
-
232
-
233
-
234
-
235
-
236
-
237
-
238
-
239
-
240
-
241
-
242
-
243
-
244
-
245
-
246
-
247
-
248
-
249
-
250
-
251
-
252
-
253
-
254
-
255
-
256
-
257
-
258
-
259
-
260
-
261
-
262
-
263
-
264
-
265
-
266
-
267
-
268
-
269
-
270
-
271
-
272
-
273
-
274
-
275
-
276
-
277
-
278
-
279
-
280
-
281
-
282
-
283
-
284
-
285
-
286
-
287
-
288
-
289
-
290
-
291
-
292
-
293
-
294
-
295
-
296
-
297
-
298
-
299
-
300
-
301
-
302
-
303
-
304
-
305
-
306
-
307
-
308
-
309
-
310
-
311
-
312
-
313
-
314
-
315
-
316
-
317
-
318
-
319
-
320
-
321
-
322
-
323
-
324
-
325
-
326
-
327
 |
 |

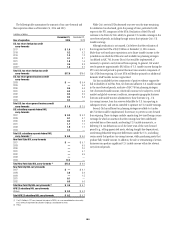
184
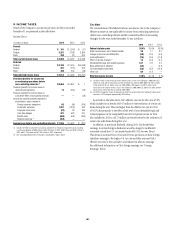
The following table summarizes the amounts of tax carry-forwards and
their expiration dates as of December 31, 2014 and 2013:
In billions of dollars
Year of expiration
December 31,
2014
December 31,
2013
U.S. tax return foreign tax credit
carry-forwards
2017 $ 1.9 $ 4.7
2018 5.2 5.2
2019 1.2 1.2
2020 3.1 3.1
2021 1.8 1.4
2022 3.4 3.3
2023 (1) 1.0 0.7
Total U.S. tax return foreign tax credit
carry-forwards $17.6 $19.6
U.S. tax return general business credit
carry-forwards
2028 $ — $ 0.4
2029 —0.4
2030 0.4 0.4
2031 0.3 0.4
2032 0.4 0.5
2033 0.3 0.4
2034 0.2 —
Total U.S. tax return general business credit
carry-forwards $ 1.6 $ 2.5
U.S. subsidiary separate federal NOL
carry-forwards
2027 $ 0.2 $ 0.2
2028 0.1 0.1
2030 0.3 0.3
2031 1.7 1.7
2033 1.9 1.7
2034 2.3 —
Total U.S. subsidiary separate federal NOL
carry-forwards (2) $ 6.5 $ 4.0
New York State NOL carry-forwards
2027 $ — $ 0.1
2028 —6.5
2030 —2.0
2031 —0.1
2032 —0.9
2033 ——
2034 12.3 —
Total New York State NOL carry-forwards (2) $12.3 $ 9.6
New York City NOL carry-forwards
2027 $ — $ 0.1
2028 3.8 3.9
2029 —1.5
2031 0.1 —
2032 0.5 0.6
Total New York City NOL carry-forwards (2) $ 4.4 $ 6.1
APB 23 subsidiary NOL carry-forwards
Various $ 0.2 $ 0.2
Total APB 23 subsidiary NOL carry-forwards $ 0.2 $ 0.2
(1) The $1.0 billion in FTC carry-forwards that expires in 2023 is in a non-consolidated tax return entity
but is eventually expected to be utilized in Citigroup’s consolidated tax return.
(2) Pretax.
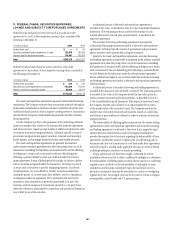
While Citi’s net total DTAs decreased year-over-year, the time remaining
for utilization has shortened, given the passage of time, particularly with
respect to the FTC component of the DTAs. Realization of the DTAs will
continue to be driven by Citi’s ability to generate U.S. taxable earnings in the
carry-forward periods, including through actions that optimize Citi’s U.S.
taxable earnings.
Although realization is not assured, Citi believes that the realization of
the recognized net DTAs of $49.5 billion at December 31, 2014 is more-
likely-than-not based upon expectations as to future taxable income in the
jurisdictions in which the DTAs arise and available tax planning strategies
(as defined in ASC 740, Income Taxes) that would be implemented, if
necessary, to prevent a carry-forward from expiring. In general, Citi would
need to generate approximately $81 billion of U.S. taxable income during the
FTC carry-forward periods to prevent this most time-sensitive component of
Citi’s DTAs from expiring. Citi’s net DTAs will decline primarily as additional
domestic GAAP taxable income is generated.
Citi has concluded that two components of positive evidence support the
full realizability of its DTAs. First, Citi forecasts sufficient U.S. taxable income
in the carry-forward periods, exclusive of ASC 740 tax planning strategies.
Citi’s forecasted taxable income, which will continue to be subject to overall
market and global economic conditions, incorporates geographic business
forecasts and taxable income adjustments to those forecasts (e.g., U.S.
tax-exempt income, loan loss reserves deductible for U.S. tax reporting in
subsequent years), and actions intended to optimize its U.S. taxable earnings.
Second, Citi has sufficient tax planning strategies available to it under
ASC 740 that would be implemented, if necessary, to prevent a carry-forward
from expiring. These strategies include: repatriating low-taxed foreign source
earnings for which an assertion that the earnings have been indefinitely
reinvested has not been made; accelerating U.S. taxable income into, or
deferring U.S. tax deductions out of, the latter years of the carry-forward
period (e.g., selling appreciated assets, electing straight-line depreciation);
accelerating deductible temporary differences outside the U.S.; and selling
certain assets that produce tax-exempt income, while purchasing assets that
produce fully taxable income. In addition, the sale or restructuring of certain
businesses can produce significant U.S. taxable income within the relevant
carry-forward periods.