Citibank 2014 Annual Report Download - page 57
Download and view the complete annual report
Please find page 57 of the 2014 Citibank annual report below. You can navigate through the pages in the report by either clicking on the pages listed below, or by using the keyword search tool below to find specific information within the annual report.-
 1
1 -
2
-
3
-
4
-
5
-
6
-
7
-
8
-
9
-
10
-
11
-
12
-
13
-
14
-
15
-
16
-
17
-
18
-
19
-
20
-
21
-
22
-
23
-
24
-
25
-
26
-
27
-
28
-
29
-
30
-
31
-
32
-
33
-
34
-
35
-
36
-
37
-
38
-
39
-
40
-
41
-
42
-
43
-
44
-
45
-
46
-
 47
47 -
 48
48 -
 49
49 -
 50
50 -
 51
51 -
 52
52 -
 53
53 -
 54
54 -
 55
55 -
 56
56 -
 57
57 -
 58
58 -
 59
59 -
 60
60 -
 61
61 -
 62
62 -
 63
63 -
 64
64 -
 65
65 -
 66
66 -
 67
67 -
68
-
69
-
70
-
71
-
72
-
73
-
74
-
75
-
76
-
77
-
78
-
79
-
80
-
81
-
82
-
83
-
84
-
85
-
86
-
87
-
88
-
89
-
90
-
91
-
92
-
93
-
94
-
95
-
96
-
97
-
98
-
99
-
100
-
101
-
102
-
103
-
104
-
105
-
106
-
107
-
108
-
109
-
110
-
111
-
112
-
113
-
114
-
115
-
116
-
117
-
118
-
119
-
120
-
121
-
122
-
123
-
124
-
125
-
126
-
127
-
128
-
129
-
130
-
131
-
132
-
133
-
134
-
135
-
136
-
137
-
138
-
139
-
140
-
141
-
142
-
143
-
144
-
145
-
146
-
147
-
148
-
149
-
150
-
151
-
152
-
153
-
154
-
155
-
156
-
157
-
158
-
159
-
160
-
161
-
162
-
163
-
164
-
165
-
166
-
167
-
168
-
169
-
170
-
171
-
172
-
173
-
174
-
175
-
176
-
177
-
178
-
179
-
180
-
181
-
182
-
183
-
184
-
185
-
186
-
187
-
188
-
189
-
190
-
191
-
192
-
193
-
194
-
195
-
196
-
197
-
198
-
199
-
200
-
201
-
202
-
203
-
204
-
205
-
206
-
207
-
208
-
209
-
210
-
211
-
212
-
213
-
214
-
215
-
216
-
217
-
218
-
219
-
220
-
221
-
222
-
223
-
224
-
225
-
226
-
227
-
228
-
229
-
230
-
231
-
232
-
233
-
234
-
235
-
236
-
237
-
238
-
239
-
240
-
241
-
242
-
243
-
244
-
245
-
246
-
247
-
248
-
249
-
250
-
251
-
252
-
253
-
254
-
255
-
256
-
257
-
258
-
259
-
260
-
261
-
262
-
263
-
264
-
265
-
266
-
267
-
268
-
269
-
270
-
271
-
272
-
273
-
274
-
275
-
276
-
277
-
278
-
279
-
280
-
281
-
282
-
283
-
284
-
285
-
286
-
287
-
288
-
289
-
290
-
291
-
292
-
293
-
294
-
295
-
296
-
297
-
298
-
299
-
300
-
301
-
302
-
303
-
304
-
305
-
306
-
307
-
308
-
309
-
310
-
311
-
312
-
313
-
314
-
315
-
316
-
317
-
318
-
319
-
320
-
321
-
322
-
323
-
324
-
325
-
326
-
327
 |
 |

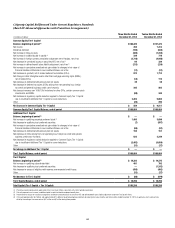
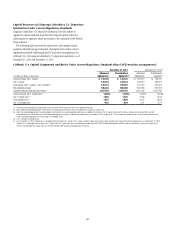
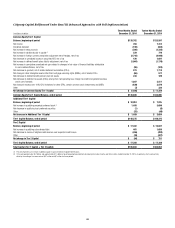
40
Components of Citigroup Capital Under Current Regulatory Standards
(Basel III Advanced Approaches with Transition Arrangements)
In millions of dollars
December 31,
2014
December 31,
2013 (1)
Common Equity Tier 1 Capital
Citigroup common stockholders’ equity (2) $200,190 $197,694
Add: Qualifying noncontrolling interests 539 597
Regulatory Capital Adjustments and Deductions:
Less: Net unrealized gains (losses) on securities AFS, net of tax (3)(4) 46 (1,312)
Less: Defined benefit plans liability adjustment, net of tax (4) (4,127) (3,191)
Less: Accumulated net unrealized losses on cash flow hedges, net of tax (5) (909) (1,245)
Less: Cumulative unrealized net gain related to changes in fair value of financial liabilities
attributable to own creditworthiness, net of tax (4)(6) 56 35
Less: Intangible assets:
Goodwill, net of related deferred tax liabilities (DTLs) (7) 22,805 24,518
Identifiable intangible assets other than mortgage servicing rights (MSRs), net of related DTLs (4) 875 990
Less: Defined benefit pension plan net assets (4) 187 225
Less: Deferred tax assets (DTAs) arising from net operating loss, foreign tax credit and general
business credit carry-forwards (4)(8) 4,726 5,288
Less: Excess over 10%/15% limitations for other DTAs, certain common stock investments,
and MSRs (4)(8)(9) 2,003 2,343
Less: Deductions applied to Common Equity Tier 1 Capital due to insufficient amount of Additional
Tier 1 Capital to cover deductions (4) 8,083 13,167
Total Common Equity Tier 1 Capital $166,984 $157,473
Additional Tier 1 Capital
Qualifying perpetual preferred stock (2) $ 10,344 $ 6,645
Qualifying trust preferred securities (10) 1,719 2,616
Qualifying noncontrolling interests 78
Regulatory Capital Adjustment and Deductions:
Less: Cumulative unrealized net gain related to changes in fair value of financial liabilities
attributable to own creditworthiness, net of tax (4)(6) 223 142
Less: Minimum regulatory capital requirements of insurance underwriting subsidiaries (11) 279 243
Less: Defined benefit pension plan net assets (4) 749 900
Less: DTAs arising from net operating loss, foreign tax credit and general
business credit carry-forwards (4)(8) 18,902 21,151
Less: Deductions applied to Common Equity Tier 1 Capital due to insufficient amount of Additional
Tier 1 Capital to cover deductions (4) (8,083) (13,167)
Total Additional Tier 1 Capital $ — $ —
Total Tier 1 Capital (Common Equity Tier 1 Capital + Additional Tier 1 Capital) $166,984 $157,473
Tier 2 Capital
Qualifying subordinated debt (12) $ 17,386 $ 16,594
Qualifying trust preferred securities (10) —1,242
Qualifying noncontrolling interests 12 13
Excess of eligible credit reserves over expected credit losses (13) 1,177 1,669
Regulatory Capital Deduction:
Less: Minimum regulatory capital requirements of insurance underwriting subsidiaries (11) 279 243
Total Tier 2 Capital $ 18,296 $ 19,275
Total Capital (Tier 1 Capital + Tier 2 Capital) $185,280 $176,748
Table and notes continue on the next page.