Citibank 2014 Annual Report Download - page 200
Download and view the complete annual report
Please find page 200 of the 2014 Citibank annual report below. You can navigate through the pages in the report by either clicking on the pages listed below, or by using the keyword search tool below to find specific information within the annual report.-
 1
1 -
2
-
3
-
4
-
5
-
6
-
7
-
8
-
9
-
10
-
11
-
12
-
13
-
14
-
15
-
16
-
17
-
18
-
19
-
20
-
21
-
22
-
23
-
24
-
25
-
26
-
27
-
28
-
29
-
30
-
31
-
32
-
33
-
34
-
35
-
36
-
37
-
38
-
39
-
40
-
41
-
42
-
43
-
44
-
45
-
46
-
47
-
48
-
49
-
50
-
51
-
52
-
53
-
54
-
55
-
56
-
57
-
58
-
59
-
60
-
61
-
62
-
63
-
64
-
65
-
66
-
67
-
68
-
69
-
70
-
71
-
72
-
73
-
74
-
75
-
76
-
77
-
78
-
79
-
80
-
81
-
82
-
83
-
84
-
85
-
86
-
87
-
88
-
89
-
90
-
91
-
92
-
93
-
94
-
95
-
96
-
97
-
98
-
99
-
100
-
101
-
102
-
103
-
104
-
105
-
106
-
107
-
108
-
109
-
110
-
111
-
112
-
113
-
114
-
115
-
116
-
117
-
118
-
119
-
120
-
121
-
122
-
123
-
124
-
125
-
126
-
127
-
128
-
129
-
130
-
131
-
132
-
133
-
134
-
135
-
136
-
137
-
138
-
139
-
140
-
141
-
142
-
143
-
144
-
145
-
146
-
147
-
148
-
149
-
150
-
151
-
152
-
153
-
154
-
155
-
156
-
157
-
158
-
159
-
160
-
161
-
162
-
163
-
164
-
165
-
166
-
167
-
168
-
169
-
170
-
171
-
172
-
173
-
174
-
175
-
176
-
177
-
178
-
179
-
180
-
181
-
182
-
183
-
184
-
185
-
186
-
187
-
188
-
189
-
 190
190 -
 191
191 -
 192
192 -
 193
193 -
 194
194 -
 195
195 -
 196
196 -
 197
197 -
 198
198 -
 199
199 -
 200
200 -
 201
201 -
 202
202 -
 203
203 -
 204
204 -
 205
205 -
 206
206 -
 207
207 -
 208
208 -
 209
209 -
 210
210 -
211
-
212
-
213
-
214
-
215
-
216
-
217
-
218
-
219
-
220
-
221
-
222
-
223
-
224
-
225
-
226
-
227
-
228
-
229
-
230
-
231
-
232
-
233
-
234
-
235
-
236
-
237
-
238
-
239
-
240
-
241
-
242
-
243
-
244
-
245
-
246
-
247
-
248
-
249
-
250
-
251
-
252
-
253
-
254
-
255
-
256
-
257
-
258
-
259
-
260
-
261
-
262
-
263
-
264
-
265
-
266
-
267
-
268
-
269
-
270
-
271
-
272
-
273
-
274
-
275
-
276
-
277
-
278
-
279
-
280
-
281
-
282
-
283
-
284
-
285
-
286
-
287
-
288
-
289
-
290
-
291
-
292
-
293
-
294
-
295
-
296
-
297
-
298
-
299
-
300
-
301
-
302
-
303
-
304
-
305
-
306
-
307
-
308
-
309
-
310
-
311
-
312
-
313
-
314
-
315
-
316
-
317
-
318
-
319
-
320
-
321
-
322
-
323
-
324
-
325
-
326
-
327
 |
 |

183
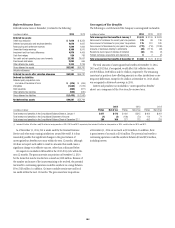
The following are the major tax jurisdictions in which the Company and
its affiliates operate and the earliest tax year subject to examination:
Jurisdiction Tax year
United States 2012
Mexico 2009
New York State and City 2006
United Kingdom 2013
India 2010
Brazil 2010
Singapore 2007
Hong Kong 2008
Ireland 2010
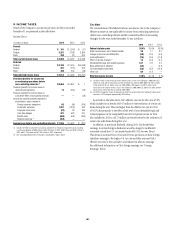
Foreign Earnings
Foreign pretax earnings approximated $10.1 billion in 2014, $13.1
billion in 2013 (of which $0.1 billion was in Discontinued operations)
and $14.7 billion in 2012. As a U.S. corporation, Citigroup and its U.S.
subsidiaries are subject to U.S. taxation on all foreign pretax earnings earned
by a foreign branch. Pretax earnings of a foreign subsidiary or affiliate are
subject to U.S. taxation when effectively repatriated. The Company provides
income taxes on the undistributed earnings of non-U.S. subsidiaries except
to the extent that such earnings are indefinitely reinvested outside the
United States.
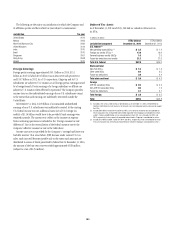
At December 31, 2014, $43.8 billion of accumulated undistributed
earnings of non-U.S. subsidiaries was indefinitely invested. At the existing
U.S. federal income tax rate, additional taxes (net of U.S. foreign tax
credits) of $11.6 billion would have to be provided if such earnings were
remitted currently. The current year’s effect on the income tax expense
from continuing operations is included in the “Foreign income tax rate
differential” line in the reconciliation of the federal statutory rate to the
Company’s effective income tax rate in the table above.
Income taxes are not provided for the Company’s “savings bank base year
bad debt reserves” that arose before 1988, because under current U.S. tax
rules, such taxes will become payable only to the extent such amounts are
distributed in excess of limits prescribed by federal law. At December 31, 2014,
the amount of the base year reserves totaled approximately $358 million
(subject to a tax of $125 million).
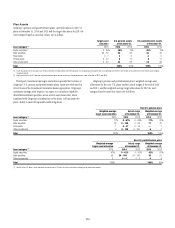
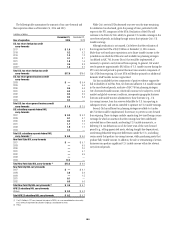
Deferred Tax Assets
As of December 31, 2014 and 2013, Citi had no valuation allowance on
its DTAs.
In billions of dollars
Jurisdiction/component
DTAs balance
December 31, 2014
DTAs balance
December 31, 2013
U.S. federal (1)
Net operating losses (NOLs) (2) $ 2.3 $ 1.4
Foreign tax credits (FTCs) (3) 17.6 19.6
General business credits (GBCs) 1.6 2.5
Future tax deductions and credits 21.3 21.5
Total U.S. federal $42.8 $45.0
State and local
New York NOLs $ 1.5 $ 1.4
Other state NOLs 0.4 0.5
Future tax deductions 2.0 2.4
Total state and local $ 3.9 $ 4.3
Foreign
APB 23 subsidiary NOLs $ 0.2 $ 0.2
Non-APB 23 subsidiary NOLs 0.5 1.2
Future tax deductions 2.1 2.1
Total foreign $ 2.8 $ 3.5
Total $49.5 $52.8
(1) Included in the net U.S. federal DTAs of $42.8 billion as of December 31, 2014 were deferred tax
liabilities of $2 billion that will reverse in the relevant carry-forward period and may be used to support
the DTAs.
(2) Includes $0.6 billion in both 2014 and 2013 of NOL carry-forwards related to non-consolidated tax
return companies that are expected to be utilized separately from Citigroup’s consolidated tax return,
and $1.7 billion and $0.8 billion of non-consolidated tax return NOL carry-forwards for 2014 and
2013, respectively, that are eventually expected to be utilized in Citigroup’s consolidated tax return.
(3) Includes $1.0 billion and $0.7 billion for 2014 and 2013, respectively, of non-consolidated tax return
FTC carry-forwards that are eventually expected to be utilized in Citigroup’s consolidated tax return.