Citibank 2014 Annual Report Download - page 34
Download and view the complete annual report
Please find page 34 of the 2014 Citibank annual report below. You can navigate through the pages in the report by either clicking on the pages listed below, or by using the keyword search tool below to find specific information within the annual report.-
 1
1 -
2
-
3
-
4
-
5
-
6
-
7
-
8
-
9
-
10
-
11
-
12
-
13
-
14
-
15
-
16
-
17
-
18
-
19
-
20
-
21
-
22
-
23
-
 24
24 -
 25
25 -
 26
26 -
 27
27 -
 28
28 -
 29
29 -
 30
30 -
 31
31 -
 32
32 -
 33
33 -
 34
34 -
 35
35 -
 36
36 -
 37
37 -
 38
38 -
 39
39 -
 40
40 -
 41
41 -
 42
42 -
 43
43 -
 44
44 -
45
-
46
-
47
-
48
-
49
-
50
-
51
-
52
-
53
-
54
-
55
-
56
-
57
-
58
-
59
-
60
-
61
-
62
-
63
-
64
-
65
-
66
-
67
-
68
-
69
-
70
-
71
-
72
-
73
-
74
-
75
-
76
-
77
-
78
-
79
-
80
-
81
-
82
-
83
-
84
-
85
-
86
-
87
-
88
-
89
-
90
-
91
-
92
-
93
-
94
-
95
-
96
-
97
-
98
-
99
-
100
-
101
-
102
-
103
-
104
-
105
-
106
-
107
-
108
-
109
-
110
-
111
-
112
-
113
-
114
-
115
-
116
-
117
-
118
-
119
-
120
-
121
-
122
-
123
-
124
-
125
-
126
-
127
-
128
-
129
-
130
-
131
-
132
-
133
-
134
-
135
-
136
-
137
-
138
-
139
-
140
-
141
-
142
-
143
-
144
-
145
-
146
-
147
-
148
-
149
-
150
-
151
-
152
-
153
-
154
-
155
-
156
-
157
-
158
-
159
-
160
-
161
-
162
-
163
-
164
-
165
-
166
-
167
-
168
-
169
-
170
-
171
-
172
-
173
-
174
-
175
-
176
-
177
-
178
-
179
-
180
-
181
-
182
-
183
-
184
-
185
-
186
-
187
-
188
-
189
-
190
-
191
-
192
-
193
-
194
-
195
-
196
-
197
-
198
-
199
-
200
-
201
-
202
-
203
-
204
-
205
-
206
-
207
-
208
-
209
-
210
-
211
-
212
-
213
-
214
-
215
-
216
-
217
-
218
-
219
-
220
-
221
-
222
-
223
-
224
-
225
-
226
-
227
-
228
-
229
-
230
-
231
-
232
-
233
-
234
-
235
-
236
-
237
-
238
-
239
-
240
-
241
-
242
-
243
-
244
-
245
-
246
-
247
-
248
-
249
-
250
-
251
-
252
-
253
-
254
-
255
-
256
-
257
-
258
-
259
-
260
-
261
-
262
-
263
-
264
-
265
-
266
-
267
-
268
-
269
-
270
-
271
-
272
-
273
-
274
-
275
-
276
-
277
-
278
-
279
-
280
-
281
-
282
-
283
-
284
-
285
-
286
-
287
-
288
-
289
-
290
-
291
-
292
-
293
-
294
-
295
-
296
-
297
-
298
-
299
-
300
-
301
-
302
-
303
-
304
-
305
-
306
-
307
-
308
-
309
-
310
-
311
-
312
-
313
-
314
-
315
-
316
-
317
-
318
-
319
-
320
-
321
-
322
-
323
-
324
-
325
-
326
-
327
 |
 |
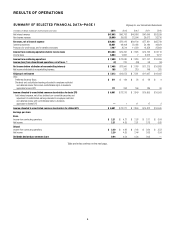
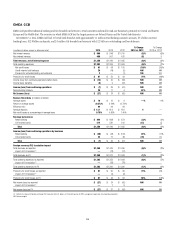
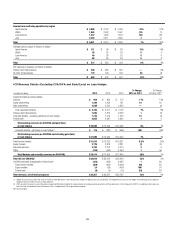
17
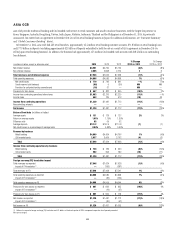
2014 vs. 2013
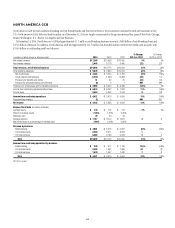
Net income increased by 13% due to lower net credit losses, higher loan loss
reserve releases and lower expenses, partially offset by lower revenues.
Revenues decreased 1%, with lower revenues in retail banking, partially
offset by higher revenues in Citi-branded cards and Citi retail services.
Net interest revenue increased 3% primarily due to an increase in average
loans in Citi retail services driven by the Best Buy portfolio acquisition in
September 2013 and continued volume growth in retail banking, which
more than offset lower average loans in Citi-branded cards. Non-interest
revenue decreased 22%, driven by lower mortgage origination revenues due
to significantly lower U.S. mortgage refinancing activity and a continued
decline in revenues in Citi retail services, primarily reflecting improving
credit and the resulting impact on contractual partner payments, partially
offset by a 5% increase in total card purchase sales to $252 billion and gains
during the year from branch sales (approximately $130 million).
Retail banking revenues of $4.9 billion decreased 9% due to the lower
mortgage origination revenues and spread compression in the deposit
portfolios, which began to abate during the latter part of the year, partially
offset by continued volume-related growth and the gains from branch sales.
Consistent with GCB’s strategy, during 2014, NA GCB closed or sold over
130 branches (a 14% decline from the prior year), with announced plans
to sell or close an additional 60 branches in early 2015. Average loans of
$46 billion increased 9% and average deposits of $171 billion increased 3%.
Cards revenues increased 2% as average loans of $110 billion increased
3% versus 2013. In Citi-branded cards, revenues increased 1% as a 4%
increase in purchase sales and higher net interest spreads, driven by the
continued reduction of promotional balances in the portfolio, mostly offset
lower average loans (3% decline from 2013). The decline in average loans
was driven primarily by the reduction in promotional balances, and to a
lesser extent, increased customer payment rates during the year. In addition,
while the business experienced modest full rate loan growth during 2014,
growth in full rate loan balances began to slow during the latter part of the
year. Combined with the continued reduction in promotional balances, NA
GCB could experience pressure on full rate loan growth during 2015.
Citi retail services revenues increased 4% primarily due to a 12% increase
in average loans driven by the Best Buy acquisition, partially offset by
continued declines in fee revenues primarily reflecting higher yields and
improving credit and the resulting increase in contractual partner payments.
Citi retail services revenues also benefited from lower funding costs, partially
offset by a decline in net interest spreads due to a higher percentage of
promotional balances within the portfolio. Purchase sales in Citi retail
services increased 7% from 2013, driven by the acquisition of the Best
Buy portfolio.
With respect to both cards portfolios, as widely publicized, U.S. gas prices
declined during 2014, particularly in the fourth quarter. The decline in
gas prices has negatively impacted purchase sales in the fuel portfolios,
particularly in Citi retail services, and consumer savings from lower gas
prices may not result in higher spending in other spend categories. NA GCB
will continue to monitor trends in this area going into 2015.
Expenses decreased 2% as ongoing cost reduction initiatives were
partially offset by higher repositioning charges, increased investment
spending and an increase in Citi retail services expenses due to the impact
of the Best Buy portfolio acquisition. Cost reduction initiatives included
the ongoing repositioning of the mortgage business due to the decline in
mortgage refinancing activity, as well as continued rationalization of the
branch footprint, including reducing the number of overall branches, as
discussed above.
Provisions decreased 18% due to lower net credit losses (9%) and higher
loan loss reserve releases (21%). Net credit losses declined in Citi-branded
cards (down 14% to $2.2 billion) and in Citi retail services (down 2% to
$1.9 billion). The loan loss reserve release increased to $1.2 billion due to the
continued improvement in Citi-branded cards, partially offset by a lower loan
loss reserve release in Citi retail services due to reserve builds for new loans
originated in the Best Buy portfolio. Given the improvement in credit within
the cards portfolios during 2014, NA GCB would not expect to see similar
levels of loan loss reserve releases in 2015.
2013 vs. 2012
Net income decreased 14%, mainly driven by lower revenues and lower loan
loss reserve releases, partially offset by lower net credit losses and expenses.
Revenues decreased 6% primarily due to lower retail banking revenues.
The decline in retail banking revenues was primarily due to lower mortgage
origination revenues driven by the significantly lower U.S. mortgage
refinancing activity and ongoing spread compression in the deposit
portfolios, partially offset by growth in average deposits, average commercial
loans and average retail loans.
Cards revenues increased 1%. In Citi-branded cards, revenues were
unchanged as continued improvement in net interest spreads, reflecting
higher yields as promotional balances represented a smaller percentage of
the portfolio total as well as lower funding costs, were offset by a decline in
average loans. Citi retail services revenues increased 3% primarily due to the
acquisition of the Best Buy portfolio, partially offset by improving credit and
the resulting impact on contractual partner payments.
Expenses decreased 3%, primarily due to lower legal and related costs and
repositioning savings, partially offset by higher mortgage origination costs
and expenses in cards as a result of the Best Buy portfolio acquisition.
Provisions increased 7%, as lower net credit losses in the Citi-branded
cards and Citi retail services portfolios were offset by lower loan loss reserve
releases ($1.0 billion in 2013 compared to $2.4 billion in 2012), primarily
related to cards, as well as reserve builds for new loans originated in the Best
Buy portfolio.