Citibank 2014 Annual Report Download - page 276
Download and view the complete annual report
Please find page 276 of the 2014 Citibank annual report below. You can navigate through the pages in the report by either clicking on the pages listed below, or by using the keyword search tool below to find specific information within the annual report.-
 1
1 -
2
-
3
-
4
-
5
-
6
-
7
-
8
-
9
-
10
-
11
-
12
-
13
-
14
-
15
-
16
-
17
-
18
-
19
-
20
-
21
-
22
-
23
-
24
-
25
-
26
-
27
-
28
-
29
-
30
-
31
-
32
-
33
-
34
-
35
-
36
-
37
-
38
-
39
-
40
-
41
-
42
-
43
-
44
-
45
-
46
-
47
-
48
-
49
-
50
-
51
-
52
-
53
-
54
-
55
-
56
-
57
-
58
-
59
-
60
-
61
-
62
-
63
-
64
-
65
-
66
-
67
-
68
-
69
-
70
-
71
-
72
-
73
-
74
-
75
-
76
-
77
-
78
-
79
-
80
-
81
-
82
-
83
-
84
-
85
-
86
-
87
-
88
-
89
-
90
-
91
-
92
-
93
-
94
-
95
-
96
-
97
-
98
-
99
-
100
-
101
-
102
-
103
-
104
-
105
-
106
-
107
-
108
-
109
-
110
-
111
-
112
-
113
-
114
-
115
-
116
-
117
-
118
-
119
-
120
-
121
-
122
-
123
-
124
-
125
-
126
-
127
-
128
-
129
-
130
-
131
-
132
-
133
-
134
-
135
-
136
-
137
-
138
-
139
-
140
-
141
-
142
-
143
-
144
-
145
-
146
-
147
-
148
-
149
-
150
-
151
-
152
-
153
-
154
-
155
-
156
-
157
-
158
-
159
-
160
-
161
-
162
-
163
-
164
-
165
-
166
-
167
-
168
-
169
-
170
-
171
-
172
-
173
-
174
-
175
-
176
-
177
-
178
-
179
-
180
-
181
-
182
-
183
-
184
-
185
-
186
-
187
-
188
-
189
-
190
-
191
-
192
-
193
-
194
-
195
-
196
-
197
-
198
-
199
-
200
-
201
-
202
-
203
-
204
-
205
-
206
-
207
-
208
-
209
-
210
-
211
-
212
-
213
-
214
-
215
-
216
-
217
-
218
-
219
-
220
-
221
-
222
-
223
-
224
-
225
-
226
-
227
-
228
-
229
-
230
-
231
-
232
-
233
-
234
-
235
-
236
-
237
-
238
-
239
-
240
-
241
-
242
-
243
-
244
-
245
-
246
-
247
-
248
-
249
-
250
-
251
-
252
-
253
-
254
-
255
-
256
-
257
-
258
-
259
-
260
-
261
-
262
-
263
-
264
-
265
-
 266
266 -
 267
267 -
 268
268 -
 269
269 -
 270
270 -
 271
271 -
 272
272 -
 273
273 -
 274
274 -
 275
275 -
 276
276 -
 277
277 -
 278
278 -
 279
279 -
 280
280 -
 281
281 -
 282
282 -
 283
283 -
 284
284 -
 285
285 -
 286
286 -
287
-
288
-
289
-
290
-
291
-
292
-
293
-
294
-
295
-
296
-
297
-
298
-
299
-
300
-
301
-
302
-
303
-
304
-
305
-
306
-
307
-
308
-
309
-
310
-
311
-
312
-
313
-
314
-
315
-
316
-
317
-
318
-
319
-
320
-
321
-
322
-
323
-
324
-
325
-
326
-
327
 |
 |

259
Creditvaluationadjustments(CVA)and,effectiveinthethirdquarter
of2014,fundingvaluationadjustments(FVA),areappliedtoover-the-
counter (OTC) derivative instruments in which the base valuation generally
discounts expected cash flows using the relevant base interest rate curve
forthecurrencyofthederivative(e.g.,LIBORforuncollateralizedU.S.
dollar derivatives). As not all counterparties have the same credit risk as
thatimpliedbytherelevantbasecurve,aCVAisnecessarytoincorporate
the market view of both counterparty credit risk and Citi’s own credit risk
inthevaluation.FVAreflectsamarketfundingriskpremiuminherentin
the uncollateralized portion of derivative portfolios, and in collateralized
derivatives where the terms of the agreement do not permit the reuse of the
collateral received.
Citi’sCVAmethodologyiscomposedoftwosteps.First,thecreditexposure
profile for each counterparty is determined using the terms of all individual
derivative positions and a Monte Carlo simulation or other quantitative
analysis to generate a series of expected cash flows at future points in time.
The calculation of this exposure profile considers the effect of credit risk
mitigants, including pledged cash or other collateral and any legal right
of offset that exists with a counterparty through arrangements such as
netting agreements. Individual derivative contracts that are subject to an
enforceable master netting agreement with a counterparty are aggregated
for this purpose, since it is those aggregate net cash flows that are subject to
nonperformance risk. This process identifies specific, point-in-time future
cash flows that are subject to nonperformance risk, rather than using the
currentrecognizednetassetorliabilityasabasistomeasuretheCVA.Second,
market-based views of default probabilities derived from observed credit
spreads in the credit default swap (CDS) market are applied to the expected
futurecashflowsdeterminedinstepone.Citi’sown-creditCVAisdetermined
using Citi-specific CDS spreads for the relevant tenor. Generally, counterparty
CVAisdeterminedusingCDSspreadindicesforeachcreditratingandtenor.
For certain identified netting sets where individual analysis is practicable
(e.g., exposures to counterparties with liquid CDSs), counterparty-specific
CDS spreads are used.
TheCVAandFVAaredesignedtoincorporateamarketviewofthecredit
and funding risk, respectively, inherent in the derivative portfolio. However,
most unsecured derivative instruments are negotiated bilateral contracts
and are not commonly transferred to third parties. Derivative instruments
are normally settled contractually or, if terminated early, are terminated at
avaluenegotiatedbilaterallybetweenthecounterparties.Thus,theCVAand
FVAmaynotberealizeduponasettlementorterminationinthenormal
course of business. In addition, all or a portion of these adjustments may be
reversed or otherwise adjusted in future periods in the event of changes in the
credit or funding risk associated with the derivative instruments.
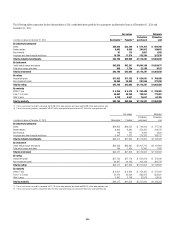
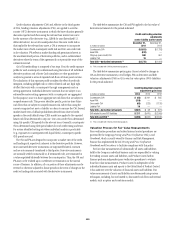
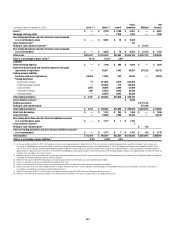
ThetablebelowsummarizestheCVAandFVAappliedtothefairvalueof
derivative instruments for the periods indicated:
Credit and funding valuation
adjustments
contra-liability (contra-asset)
In millions of dollars
December 31,
2014
December 31,
2013
Counterparty CVA $(1,853) $(1,733)
Asset FVA (518) —
Citigroup (own-credit) CVA 580 651
Liability FVA 19 —
Total CVA—derivative instruments (1) $(1,772) $(1,082)
(1) FVA is included with CVA for presentation purposes.
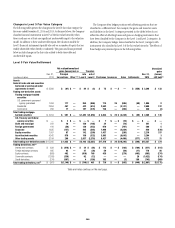
The table below summarizes pretax gains (losses) related to changes in
CVAonderivativeinstruments,netofhedges,FVAonderivativesanddebt
valuationadjustments(DVA)onCiti’sownfairvalueoption(FVO)liabilities
for the periods indicated:
Credit/funding/debt valuation
adjustments gain (loss)
In millions of dollars 2014 2013 2012
Counterparty CVA $ (43) $ 291 $ 805
Asset FVA (518) — —
Own-credit CVA (65) (223) (1,126)
Liability FVA 19 — —
Total CVA—derivative instruments $(607) $ 68 $ (321)
DVA related to own FVO liabilities $ 217 $(410) $(2,009)
Total CVA and DVA (1) $(390) $(342) $(2,330)
(1) FVA is included with CVA for presentation purposes.
Valuation Process for Fair Value Measurements
Price verification procedures and related internal control procedures are
governed by the Citigroup Pricing and Price Verification Policy and
Standards,whichisjointlyownedbyFinanceandRiskManagement.
Finance has implemented the ICG Pricing and Price Verification
Standards and Procedures to facilitate compliance with this policy.
For fair value measurements of substantially all assets and liabilities
held by the Company, individual business units are responsible for valuing
the trading account assets and liabilities, and Product Control within
Finance performs independent price verification procedures to evaluate
those fair value measurements. Product Control is independent of the
individual business units and reports to the Global Head of Product Control.
It has authority over the valuation of financial assets and liabilities. Fair
value measurements of assets and liabilities are determined using various
techniques, including, but not limited to, discounted cash flows and internal
models, such as option and correlation models.