Citibank 2014 Annual Report Download - page 218
Download and view the complete annual report
Please find page 218 of the 2014 Citibank annual report below. You can navigate through the pages in the report by either clicking on the pages listed below, or by using the keyword search tool below to find specific information within the annual report.-
 1
1 -
2
-
3
-
4
-
5
-
6
-
7
-
8
-
9
-
10
-
11
-
12
-
13
-
14
-
15
-
16
-
17
-
18
-
19
-
20
-
21
-
22
-
23
-
24
-
25
-
26
-
27
-
28
-
29
-
30
-
31
-
32
-
33
-
34
-
35
-
36
-
37
-
38
-
39
-
40
-
41
-
42
-
43
-
44
-
45
-
46
-
47
-
48
-
49
-
50
-
51
-
52
-
53
-
54
-
55
-
56
-
57
-
58
-
59
-
60
-
61
-
62
-
63
-
64
-
65
-
66
-
67
-
68
-
69
-
70
-
71
-
72
-
73
-
74
-
75
-
76
-
77
-
78
-
79
-
80
-
81
-
82
-
83
-
84
-
85
-
86
-
87
-
88
-
89
-
90
-
91
-
92
-
93
-
94
-
95
-
96
-
97
-
98
-
99
-
100
-
101
-
102
-
103
-
104
-
105
-
106
-
107
-
108
-
109
-
110
-
111
-
112
-
113
-
114
-
115
-
116
-
117
-
118
-
119
-
120
-
121
-
122
-
123
-
124
-
125
-
126
-
127
-
128
-
129
-
130
-
131
-
132
-
133
-
134
-
135
-
136
-
137
-
138
-
139
-
140
-
141
-
142
-
143
-
144
-
145
-
146
-
147
-
148
-
149
-
150
-
151
-
152
-
153
-
154
-
155
-
156
-
157
-
158
-
159
-
160
-
161
-
162
-
163
-
164
-
165
-
166
-
167
-
168
-
169
-
170
-
171
-
172
-
173
-
174
-
175
-
176
-
177
-
178
-
179
-
180
-
181
-
182
-
183
-
184
-
185
-
186
-
187
-
188
-
189
-
190
-
191
-
192
-
193
-
194
-
195
-
196
-
197
-
198
-
199
-
200
-
201
-
202
-
203
-
204
-
205
-
206
-
207
-
 208
208 -
 209
209 -
 210
210 -
 211
211 -
 212
212 -
 213
213 -
 214
214 -
 215
215 -
 216
216 -
 217
217 -
 218
218 -
 219
219 -
 220
220 -
 221
221 -
 222
222 -
 223
223 -
 224
224 -
 225
225 -
 226
226 -
 227
227 -
 228
228 -
229
-
230
-
231
-
232
-
233
-
234
-
235
-
236
-
237
-
238
-
239
-
240
-
241
-
242
-
243
-
244
-
245
-
246
-
247
-
248
-
249
-
250
-
251
-
252
-
253
-
254
-
255
-
256
-
257
-
258
-
259
-
260
-
261
-
262
-
263
-
264
-
265
-
266
-
267
-
268
-
269
-
270
-
271
-
272
-
273
-
274
-
275
-
276
-
277
-
278
-
279
-
280
-
281
-
282
-
283
-
284
-
285
-
286
-
287
-
288
-
289
-
290
-
291
-
292
-
293
-
294
-
295
-
296
-
297
-
298
-
299
-
300
-
301
-
302
-
303
-
304
-
305
-
306
-
307
-
308
-
309
-
310
-
311
-
312
-
313
-
314
-
315
-
316
-
317
-
318
-
319
-
320
-
321
-
322
-
323
-
324
-
325
-
326
-
327
 |
 |

201
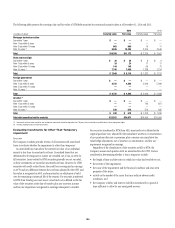
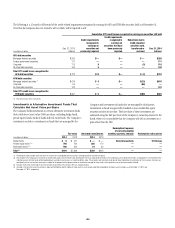
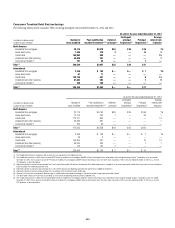
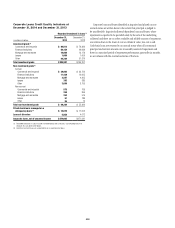
The following tables provide details on Citigroup’s consumer loan delinquency and non-accrual loans as of December 31, 2014 and December 31, 2013:
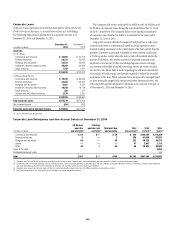
Consumer Loan Delinquency and Non-Accrual Details at December 31, 2014
In millions of dollars
Total
current (1)(2)
30-89 days
past due (3) ≥ 90 days
past due (3)
Past due
government
guaranteed (4)
Total
loans (2)
Total
non-accrual
90 days past due
and accruing
In North America offices
Residential first mortgages $ 61,730 $1,280 $ 1,371 $ 3,443 $ 67,824 $2,746 $ 2,759
Home equity loans (5) 27,262 335 520 — 28,117 1,271 —
Credit cards 111,441 1,316 1,271 — 114,028 — 1,273
Installment and other 12,361 229 284 — 12,874 254 3
Commercial market loans 8,630 31 13 — 8,674 135 15
Total $221,424 $ 3,191 $ 3,459 $ 3,443 $231,517 $ 4,406 $ 4,050
In offices outside North America
Residential first mortgages $ 44,782 $ 312 $ 223 $ — $ 45,317 $ 454 $ —
Home equity loans (5) — — — — — — —
Credit cards 30,327 602 553 — 31,482 413 322
Installment and other 29,297 328 149 — 29,774 216 —
Commercial market loans 31,280 86 255 — 31,621 405 —
Total $135,686 $ 1,328 $ 1,180 $ — $138,194 $ 1,488 $ 322
Total GCB and Citi Holdings $357,110 $ 4,519 $ 4,639 $ 3,443 $369,711 $ 5,894 $ 4,372
Other 238 10 11 — 259 30 —
Total Citigroup $357,348 $ 4,529 $ 4,650 $ 3,443 $369,970 $ 5,924 $ 4,372
(1) Loans less than 30 days past due are presented as current.
(2) Includes $43 million of residential first mortgages recorded at fair value.
(3) Excludes loans guaranteed by U.S. government-sponsored entities.
(4) Consists of residential first mortgages that are guaranteed by U.S. government-sponsored entities that are 30–89 days past due of $0.6 billion and 90 days past due of $2.8 billion.
(5) Fixed rate home equity loans and loans extended under home equity lines of credit, which are typically in junior lien positions.
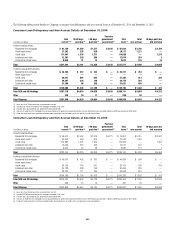
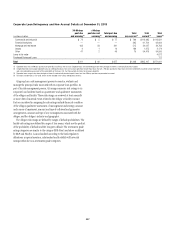
Consumer Loan Delinquency and Non-Accrual Details at December 31, 2013
In millions of dollars
Total
current (1)(2)
30-89 days
past due (3) ≥ 90 days
past due (3)
Past due
government
guaranteed (4)
Total
loans (2)
Total
non-accrual
90 days past due
and accruing
In North America offices
Residential first mortgages $ 66,612 $ 2,044 $ 1,975 $ 5,271 $ 75,902 $3,415 $ 3,997
Home equity loans (5) 30,603 434 605 — 31,642 1,452 —
Credit cards 113,886 1,491 1,452 — 116,829 — 1,452
Installment and other 12,609 225 243 — 13,077 247 7
Commercial market loans 8,630 26 28 — 8,684 112 7
Total $232,340 $ 4,220 $ 4,303 $ 5,271 $246,134 $ 5,226 $ 5,463
In offices outside North America
Residential first mortgages $ 46,067 $ 435 $ 332 $ — $ 46,834 $ 584 $ —
Home equity loans (5) — — — — — — —
Credit cards 34,733 780 641 — 36,154 402 413
Installment and other 30,138 398 158 — 30,694 230 —
Commercial market loans 33,242 111 295 — 33,648 610 —
Total $144,180 $ 1,724 $ 1,426 $ — $147,330 $ 1,826 $ 413
Total GCB and Citi Holdings $376,520 $ 5,944 $ 5,729 $ 5,271 $393,464 $ 7,052 $ 5,876
Other 338 13 16 — 367 43 —
Total Citigroup $376,858 $ 5,957 $ 5,745 $ 5,271 $393,831 $ 7,095 $ 5,876
(1) Loans less than 30 days past due are presented as current.
(2) Includes $0.9 billion of residential first mortgages recorded at fair value.
(3) Excludes loans guaranteed by U.S. government-sponsored entities.
(4) Consists of residential first mortgages that are guaranteed by U.S. government-sponsored entities that are 30–89 days past due of $1.2 billion and 90 days past due of $4.1 billion.
(5) Fixed rate home equity loans and loans extended under home equity lines of credit, which are typically in junior lien positions.