Citibank 2014 Annual Report Download - page 258
Download and view the complete annual report
Please find page 258 of the 2014 Citibank annual report below. You can navigate through the pages in the report by either clicking on the pages listed below, or by using the keyword search tool below to find specific information within the annual report.-
 1
1 -
2
-
3
-
4
-
5
-
6
-
7
-
8
-
9
-
10
-
11
-
12
-
13
-
14
-
15
-
16
-
17
-
18
-
19
-
20
-
21
-
22
-
23
-
24
-
25
-
26
-
27
-
28
-
29
-
30
-
31
-
32
-
33
-
34
-
35
-
36
-
37
-
38
-
39
-
40
-
41
-
42
-
43
-
44
-
45
-
46
-
47
-
48
-
49
-
50
-
51
-
52
-
53
-
54
-
55
-
56
-
57
-
58
-
59
-
60
-
61
-
62
-
63
-
64
-
65
-
66
-
67
-
68
-
69
-
70
-
71
-
72
-
73
-
74
-
75
-
76
-
77
-
78
-
79
-
80
-
81
-
82
-
83
-
84
-
85
-
86
-
87
-
88
-
89
-
90
-
91
-
92
-
93
-
94
-
95
-
96
-
97
-
98
-
99
-
100
-
101
-
102
-
103
-
104
-
105
-
106
-
107
-
108
-
109
-
110
-
111
-
112
-
113
-
114
-
115
-
116
-
117
-
118
-
119
-
120
-
121
-
122
-
123
-
124
-
125
-
126
-
127
-
128
-
129
-
130
-
131
-
132
-
133
-
134
-
135
-
136
-
137
-
138
-
139
-
140
-
141
-
142
-
143
-
144
-
145
-
146
-
147
-
148
-
149
-
150
-
151
-
152
-
153
-
154
-
155
-
156
-
157
-
158
-
159
-
160
-
161
-
162
-
163
-
164
-
165
-
166
-
167
-
168
-
169
-
170
-
171
-
172
-
173
-
174
-
175
-
176
-
177
-
178
-
179
-
180
-
181
-
182
-
183
-
184
-
185
-
186
-
187
-
188
-
189
-
190
-
191
-
192
-
193
-
194
-
195
-
196
-
197
-
198
-
199
-
200
-
201
-
202
-
203
-
204
-
205
-
206
-
207
-
208
-
209
-
210
-
211
-
212
-
213
-
214
-
215
-
216
-
217
-
218
-
219
-
220
-
221
-
222
-
223
-
224
-
225
-
226
-
227
-
228
-
229
-
230
-
231
-
232
-
233
-
234
-
235
-
236
-
237
-
238
-
239
-
240
-
241
-
242
-
243
-
244
-
245
-
246
-
247
-
 248
248 -
 249
249 -
 250
250 -
 251
251 -
 252
252 -
 253
253 -
 254
254 -
 255
255 -
 256
256 -
 257
257 -
 258
258 -
 259
259 -
 260
260 -
 261
261 -
 262
262 -
 263
263 -
 264
264 -
 265
265 -
 266
266 -
 267
267 -
 268
268 -
269
-
270
-
271
-
272
-
273
-
274
-
275
-
276
-
277
-
278
-
279
-
280
-
281
-
282
-
283
-
284
-
285
-
286
-
287
-
288
-
289
-
290
-
291
-
292
-
293
-
294
-
295
-
296
-
297
-
298
-
299
-
300
-
301
-
302
-
303
-
304
-
305
-
306
-
307
-
308
-
309
-
310
-
311
-
312
-
313
-
314
-
315
-
316
-
317
-
318
-
319
-
320
-
321
-
322
-
323
-
324
-
325
-
326
-
327
 |
 |

241
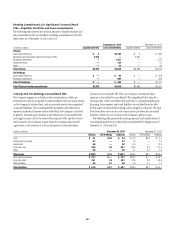
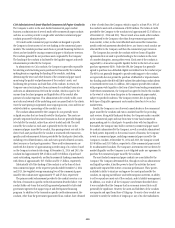
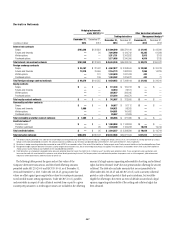
The Company continues to monitor its involvement in unconsolidated
CDOs/CLOs to assess future consolidation risk. For example, if the Company
were to acquire additional interests in these entities and obtain the right, due
to an event of default trigger being met, to unilaterally liquidate or direct
the activities of a CDO/CLO, the Company may be required to consolidate
the asset entity. For cash CDOs/CLOs, the net result of such consolidation
would be to gross up the Company’s balance sheet by the current fair value
of the securities held by third parties and assets held by the CDO/CLO, which
amounts are not considered material. For synthetic CDOs/CLOs, the net result
of such consolidation may reduce the Company’s balance sheet, because
intercompany derivative receivables and payables would be eliminated in
consolidation, and other assets held by the CDO/CLO and the securities held
by third parties would be recognized at their current fair values.
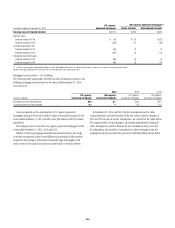
Key Assumptions and Retained Interests—Citicorp
At December 31, 2014 and 2013, the key assumptions used to value retained
interests in CLOs, and the sensitivity of the fair value to adverse changes of
10% and 20% are set forth in the tables below:
December 31, 2014 December 31, 2013
Discount rate 1.4% to 1.6% 1.5% to 1.6%
December 31, 2014
In millions of dollars CLO
Carrying value of retained interests $1,539
Value of underlying portfolio
Adverse change of 10% $ (9)
Adverse change of 20% (18)
December 31, 2013
In millions of dollars CLO
Carrying value of retained interests $1,333
Value of underlying portfolio
Adverse change of 10% $ (7)
Adverse change of 20% (14)
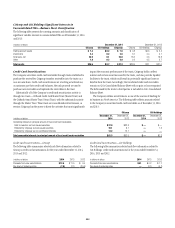
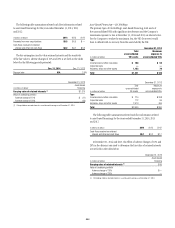
Key Assumptions and Retained Interests—Citi Holdings
At December 31, 2014 and 2013, the key assumptions used to value retained
interests, and the sensitivity of the fair value to adverse changes of 10% and
20% are set forth in the tables below:
December 31, 2014
CDOs CLOs
Discount rate 44.7% to 49.2% 4.5% to 5.0%
December 31, 2013
CDOs CLOs
Discount rate 44.3% to 48.7% 4.5% to 5.0%
December 31, 2014
In millions of dollars CDOs CLOs
Carrying value of retained interests $ 6 $10
Discount rates
Adverse change of 10% $ (1) $—
Adverse change of 20% (2) —
December 31, 2013
In millions of dollars CDOs CLOs
Carrying value of retained interests $19 $31
Discount rates
Adverse change of 10% $ (1) $—
Adverse change of 20% (2) —
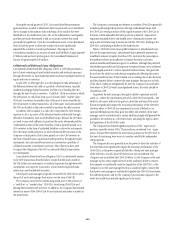
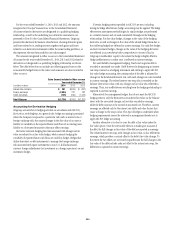
Asset-Based Financing
The Company provides loans and other forms of financing to VIEs that hold
assets. Those loans are subject to the same credit approvals as all other loans
originated or purchased by the Company. Financings in the form of debt
securities or derivatives are, in most circumstances, reported in Trading
account assets and accounted for at fair value through earnings. The
Company generally does not have the power to direct the activities that most
significantly impact these VIEs’ economic performance, and thus it does not
consolidate them.
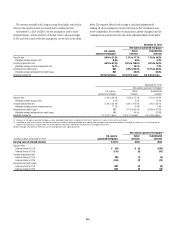
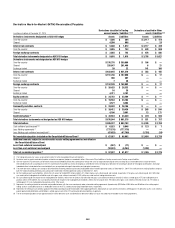
Asset-Based Financing—Citicorp
The primary types of Citicorp’s asset-based financings, total assets of the
unconsolidated VIEs with significant involvement, and the Company’s
maximum exposure to loss at December 31, 2014 and 2013 are shown below.
For the Company to realize the maximum loss, the VIE (borrower) would
have to default with no recovery from the assets held by the VIE.
December 31, 2014
In millions of dollars
Total
unconsolidated
VIE assets
Maximum
exposure to
unconsolidated VIEs
Type
Commercial and other real estate $25,978 $ 9,426
Corporate loans 460 473
Airplanes, ships and other assets 34,990 15,573
Total $61,428 $25,472
December 31, 2013
In millions of dollars
Total
unconsolidated
VIE assets
Maximum
exposure to
unconsolidated VIEs
Type
Commercial and other real estate $14,042 $ 3,902
Corporate loans 2,221 1,754
Airplanes, ships and other assets 28,650 12,958
Total $44,913 $18,614