Citibank 2014 Annual Report Download - page 293
Download and view the complete annual report
Please find page 293 of the 2014 Citibank annual report below. You can navigate through the pages in the report by either clicking on the pages listed below, or by using the keyword search tool below to find specific information within the annual report.-
 1
1 -
2
-
3
-
4
-
5
-
6
-
7
-
8
-
9
-
10
-
11
-
12
-
13
-
14
-
15
-
16
-
17
-
18
-
19
-
20
-
21
-
22
-
23
-
24
-
25
-
26
-
27
-
28
-
29
-
30
-
31
-
32
-
33
-
34
-
35
-
36
-
37
-
38
-
39
-
40
-
41
-
42
-
43
-
44
-
45
-
46
-
47
-
48
-
49
-
50
-
51
-
52
-
53
-
54
-
55
-
56
-
57
-
58
-
59
-
60
-
61
-
62
-
63
-
64
-
65
-
66
-
67
-
68
-
69
-
70
-
71
-
72
-
73
-
74
-
75
-
76
-
77
-
78
-
79
-
80
-
81
-
82
-
83
-
84
-
85
-
86
-
87
-
88
-
89
-
90
-
91
-
92
-
93
-
94
-
95
-
96
-
97
-
98
-
99
-
100
-
101
-
102
-
103
-
104
-
105
-
106
-
107
-
108
-
109
-
110
-
111
-
112
-
113
-
114
-
115
-
116
-
117
-
118
-
119
-
120
-
121
-
122
-
123
-
124
-
125
-
126
-
127
-
128
-
129
-
130
-
131
-
132
-
133
-
134
-
135
-
136
-
137
-
138
-
139
-
140
-
141
-
142
-
143
-
144
-
145
-
146
-
147
-
148
-
149
-
150
-
151
-
152
-
153
-
154
-
155
-
156
-
157
-
158
-
159
-
160
-
161
-
162
-
163
-
164
-
165
-
166
-
167
-
168
-
169
-
170
-
171
-
172
-
173
-
174
-
175
-
176
-
177
-
178
-
179
-
180
-
181
-
182
-
183
-
184
-
185
-
186
-
187
-
188
-
189
-
190
-
191
-
192
-
193
-
194
-
195
-
196
-
197
-
198
-
199
-
200
-
201
-
202
-
203
-
204
-
205
-
206
-
207
-
208
-
209
-
210
-
211
-
212
-
213
-
214
-
215
-
216
-
217
-
218
-
219
-
220
-
221
-
222
-
223
-
224
-
225
-
226
-
227
-
228
-
229
-
230
-
231
-
232
-
233
-
234
-
235
-
236
-
237
-
238
-
239
-
240
-
241
-
242
-
243
-
244
-
245
-
246
-
247
-
248
-
249
-
250
-
251
-
252
-
253
-
254
-
255
-
256
-
257
-
258
-
259
-
260
-
261
-
262
-
263
-
264
-
265
-
266
-
267
-
268
-
269
-
270
-
271
-
272
-
273
-
274
-
275
-
276
-
277
-
278
-
279
-
280
-
281
-
282
-
 283
283 -
 284
284 -
 285
285 -
 286
286 -
 287
287 -
 288
288 -
 289
289 -
 290
290 -
 291
291 -
 292
292 -
 293
293 -
 294
294 -
 295
295 -
 296
296 -
 297
297 -
 298
298 -
 299
299 -
 300
300 -
 301
301 -
 302
302 -
 303
303 -
304
-
305
-
306
-
307
-
308
-
309
-
310
-
311
-
312
-
313
-
314
-
315
-
316
-
317
-
318
-
319
-
320
-
321
-
322
-
323
-
324
-
325
-
326
-
327
 |
 |
276
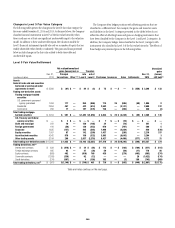
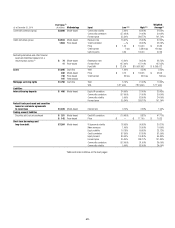
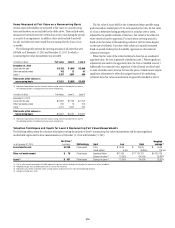
Items Measured at Fair Value on a Nonrecurring Basis
Certain assets and liabilities are measured at fair value on a nonrecurring
basis and therefore are not included in the tables above. These include assets
measured at cost that have been written down to fair value during the periods
as a result of an impairment. In addition, these assets include loans held-
for-sale and other real estate owned that are measured at the lower of cost
or market.
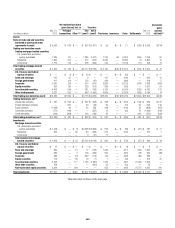
The following table presents the carrying amounts of all assets that were
still held as of December 31, 2014 and December 31, 2013, for which a
nonrecurring fair value measurement was recorded:
In millions of dollars Fair value Level 2 Level 3
December 31, 2014
Loans held-for-sale $ 4,152 $ 1,084 $ 3,068
Other real estate owned 102 21 81
Loans (1) 3,367 2,881 486
Total assets at fair value on a
nonrecurring basis $7,621 $3,986 $3,635
(1) Represents impaired loans held for investment whose carrying amount is based on the fair value of
the underlying collateral, including primarily real-estate secured loans.
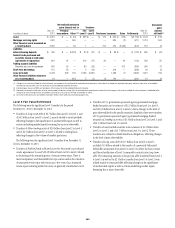
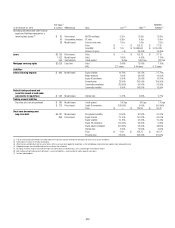
In millions of dollars Fair value Level 2 Level 3
December 31, 2013
Loans held-for-sale $3,483 $2,165 $1,318
Other real estate owned 138 15 123
Loans (1) 4,713 3,947 766
Total assets at fair value on a
nonrecurring basis $ 8,334 $ 6,127 $ 2,207
(1) Represents impaired loans held for investment whose carrying amount is based on the fair value of
the underlying collateral, including primarily real-estate secured loans.
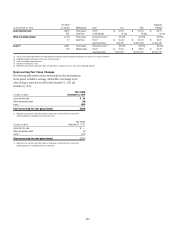
The fair value of loans-held-for-sale is determined where possible using
quoted secondary-market prices. If no such quoted price exists, the fair value
of a loan is determined using quoted prices for a similar asset or assets,
adjusted for the specific attributes of that loan. Fair value for the other real
estate owned is based on appraisals. For loans whose carrying amount is
based on the fair value of the underlying collateral, the fair values depend
on the type of collateral. Fair value of the collateral is typically estimated
based on quoted market prices if available, appraisals or other internal
valuation techniques.
Where the fair value of the related collateral is based on an unadjusted
appraised value, the loan is generally classified as Level 2. Where significant
adjustments are made to the appraised value, the loan is classified as Level 3.
Additionally, for corporate loans, appraisals of the collateral are often based
on sales of similar assets; however, because the prices of similar assets require
significant adjustments to reflect the unique features of the underlying
collateral, these fair value measurements are generally classified as Level 3.
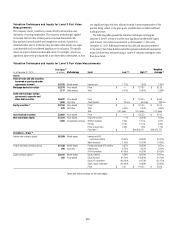
Valuation Techniques and Inputs for Level 3 Nonrecurring Fair Value Measurements
The following tables present the valuation techniques covering the majority of Level 3 nonrecurring fair value measurements and the most significant
unobservable inputs used in those measurements as of December 31, 2014 and December 31, 2013:
Fair Value (1) Weighted
average
As of December 31, 2014 (in millions) Methodology Input Low High (2)
Loans held-for-sale $2,740 Price-based Price $ 92.00 $ 100.00 $ 99.54
Credit spread 5 bps 358 bps 175 bps
Other real estate owned $ 76 Price-based Appraised Value $11,000 $11,124,137 $4,730,129
Discount to price (4) 13.00% 64.00% 28.80%
Loans (3) $ 437 Price-based Discount to price (4) 13.00% 34.00% 28.92%
(1) The fair value amounts presented in this table represent the primary valuation technique or techniques for each class of assets or liabilities.
(2) Weighted averages are calculated based on the fair value of the instrument.
(3) Represents loans held for investment whose carrying amounts are based on the fair value of the underlying collateral.
(4) Includes estimated costs to sell.