Citibank 2014 Annual Report Download - page 131
Download and view the complete annual report
Please find page 131 of the 2014 Citibank annual report below. You can navigate through the pages in the report by either clicking on the pages listed below, or by using the keyword search tool below to find specific information within the annual report.-
 1
1 -
2
-
3
-
4
-
5
-
6
-
7
-
8
-
9
-
10
-
11
-
12
-
13
-
14
-
15
-
16
-
17
-
18
-
19
-
20
-
21
-
22
-
23
-
24
-
25
-
26
-
27
-
28
-
29
-
30
-
31
-
32
-
33
-
34
-
35
-
36
-
37
-
38
-
39
-
40
-
41
-
42
-
43
-
44
-
45
-
46
-
47
-
48
-
49
-
50
-
51
-
52
-
53
-
54
-
55
-
56
-
57
-
58
-
59
-
60
-
61
-
62
-
63
-
64
-
65
-
66
-
67
-
68
-
69
-
70
-
71
-
72
-
73
-
74
-
75
-
76
-
77
-
78
-
79
-
80
-
81
-
82
-
83
-
84
-
85
-
86
-
87
-
88
-
89
-
90
-
91
-
92
-
93
-
94
-
95
-
96
-
97
-
98
-
99
-
100
-
101
-
102
-
103
-
104
-
105
-
106
-
107
-
108
-
109
-
110
-
111
-
112
-
113
-
114
-
115
-
116
-
117
-
118
-
119
-
120
-
 121
121 -
 122
122 -
 123
123 -
 124
124 -
 125
125 -
 126
126 -
 127
127 -
 128
128 -
 129
129 -
 130
130 -
 131
131 -
 132
132 -
 133
133 -
 134
134 -
 135
135 -
 136
136 -
 137
137 -
 138
138 -
 139
139 -
 140
140 -
 141
141 -
142
-
143
-
144
-
145
-
146
-
147
-
148
-
149
-
150
-
151
-
152
-
153
-
154
-
155
-
156
-
157
-
158
-
159
-
160
-
161
-
162
-
163
-
164
-
165
-
166
-
167
-
168
-
169
-
170
-
171
-
172
-
173
-
174
-
175
-
176
-
177
-
178
-
179
-
180
-
181
-
182
-
183
-
184
-
185
-
186
-
187
-
188
-
189
-
190
-
191
-
192
-
193
-
194
-
195
-
196
-
197
-
198
-
199
-
200
-
201
-
202
-
203
-
204
-
205
-
206
-
207
-
208
-
209
-
210
-
211
-
212
-
213
-
214
-
215
-
216
-
217
-
218
-
219
-
220
-
221
-
222
-
223
-
224
-
225
-
226
-
227
-
228
-
229
-
230
-
231
-
232
-
233
-
234
-
235
-
236
-
237
-
238
-
239
-
240
-
241
-
242
-
243
-
244
-
245
-
246
-
247
-
248
-
249
-
250
-
251
-
252
-
253
-
254
-
255
-
256
-
257
-
258
-
259
-
260
-
261
-
262
-
263
-
264
-
265
-
266
-
267
-
268
-
269
-
270
-
271
-
272
-
273
-
274
-
275
-
276
-
277
-
278
-
279
-
280
-
281
-
282
-
283
-
284
-
285
-
286
-
287
-
288
-
289
-
290
-
291
-
292
-
293
-
294
-
295
-
296
-
297
-
298
-
299
-
300
-
301
-
302
-
303
-
304
-
305
-
306
-
307
-
308
-
309
-
310
-
311
-
312
-
313
-
314
-
315
-
316
-
317
-
318
-
319
-
320
-
321
-
322
-
323
-
324
-
325
-
326
-
327
 |
 |
114
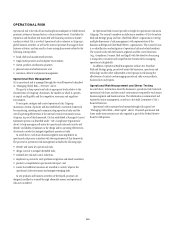
Stress Testing
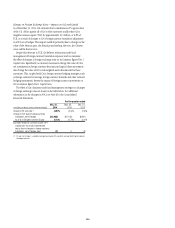
Citi performs stress testing on a regular basis to estimate the impact of
extreme market movements. It is performed on individual positions and
trading portfolios, as well as in aggregate inclusive of multiple trading
portfolios. Citi’s independent market risk management organization, after
consultations with the businesses, develops both systemic and specific stress
scenarios, reviews the output of periodic stress testing exercises, and uses the
information to assess the ongoing appropriateness of exposure levels and
limits. Citi uses two complementary approaches to market risk stress testing
across all major risk factors (i.e., equity, foreign exchange, commodity,
interest rate and credit spreads): top-down systemic stresses and bottom-
up business specific stresses. Systemic stresses are designed to quantify the
potential impact of extreme market movements on a firm-wide basis, and are
constructed using both historical periods of market stress and projections of
adverse economic scenarios. Business specific stresses are designed to probe
the risks of particular portfolios and market segments, especially those risks
that are not fully captured in VAR and systemic stresses.
The systemic stress scenarios and business specific stress scenarios at
Citi are used in several reports reviewed by senior management and also to
calculate internal risk capital for trading market risk. In general, changes in
market factors are defined over a one-year horizon. However, for the purpose
of calculating internal risk capital, changes in a very limited number of
the most liquid market factors are defined over a shorter three-month
horizon. The limited set of market factors subject to the shorter three-month
time horizon are those that in management’s judgment have historically
remained very liquid during financial crises, even as the trading liquidity of
most other market factors materially decreased.
Factor Sensitivities
Factor sensitivities are expressed as the change in the value of a position for
a defined change in a market risk factor, such as a change in the value of a
Treasury bill for a one-basis-point change in interest rates. Citi’s independent
market risk management ensures that factor sensitivities are calculated,
monitored, and in most cases, limited, for all material risks taken in a
trading portfolio.