Citibank 2014 Annual Report Download - page 184
Download and view the complete annual report
Please find page 184 of the 2014 Citibank annual report below. You can navigate through the pages in the report by either clicking on the pages listed below, or by using the keyword search tool below to find specific information within the annual report.-
 1
1 -
2
-
3
-
4
-
5
-
6
-
7
-
8
-
9
-
10
-
11
-
12
-
13
-
14
-
15
-
16
-
17
-
18
-
19
-
20
-
21
-
22
-
23
-
24
-
25
-
26
-
27
-
28
-
29
-
30
-
31
-
32
-
33
-
34
-
35
-
36
-
37
-
38
-
39
-
40
-
41
-
42
-
43
-
44
-
45
-
46
-
47
-
48
-
49
-
50
-
51
-
52
-
53
-
54
-
55
-
56
-
57
-
58
-
59
-
60
-
61
-
62
-
63
-
64
-
65
-
66
-
67
-
68
-
69
-
70
-
71
-
72
-
73
-
74
-
75
-
76
-
77
-
78
-
79
-
80
-
81
-
82
-
83
-
84
-
85
-
86
-
87
-
88
-
89
-
90
-
91
-
92
-
93
-
94
-
95
-
96
-
97
-
98
-
99
-
100
-
101
-
102
-
103
-
104
-
105
-
106
-
107
-
108
-
109
-
110
-
111
-
112
-
113
-
114
-
115
-
116
-
117
-
118
-
119
-
120
-
121
-
122
-
123
-
124
-
125
-
126
-
127
-
128
-
129
-
130
-
131
-
132
-
133
-
134
-
135
-
136
-
137
-
138
-
139
-
140
-
141
-
142
-
143
-
144
-
145
-
146
-
147
-
148
-
149
-
150
-
151
-
152
-
153
-
154
-
155
-
156
-
157
-
158
-
159
-
160
-
161
-
162
-
163
-
164
-
165
-
166
-
167
-
168
-
169
-
170
-
171
-
172
-
173
-
 174
174 -
 175
175 -
 176
176 -
 177
177 -
 178
178 -
 179
179 -
 180
180 -
 181
181 -
 182
182 -
 183
183 -
 184
184 -
 185
185 -
 186
186 -
 187
187 -
 188
188 -
 189
189 -
 190
190 -
 191
191 -
 192
192 -
 193
193 -
 194
194 -
195
-
196
-
197
-
198
-
199
-
200
-
201
-
202
-
203
-
204
-
205
-
206
-
207
-
208
-
209
-
210
-
211
-
212
-
213
-
214
-
215
-
216
-
217
-
218
-
219
-
220
-
221
-
222
-
223
-
224
-
225
-
226
-
227
-
228
-
229
-
230
-
231
-
232
-
233
-
234
-
235
-
236
-
237
-
238
-
239
-
240
-
241
-
242
-
243
-
244
-
245
-
246
-
247
-
248
-
249
-
250
-
251
-
252
-
253
-
254
-
255
-
256
-
257
-
258
-
259
-
260
-
261
-
262
-
263
-
264
-
265
-
266
-
267
-
268
-
269
-
270
-
271
-
272
-
273
-
274
-
275
-
276
-
277
-
278
-
279
-
280
-
281
-
282
-
283
-
284
-
285
-
286
-
287
-
288
-
289
-
290
-
291
-
292
-
293
-
294
-
295
-
296
-
297
-
298
-
299
-
300
-
301
-
302
-
303
-
304
-
305
-
306
-
307
-
308
-
309
-
310
-
311
-
312
-
313
-
314
-
315
-
316
-
317
-
318
-
319
-
320
-
321
-
322
-
323
-
324
-
325
-
326
-
327
 |
 |

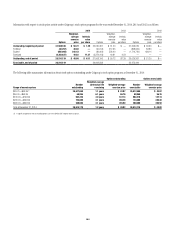
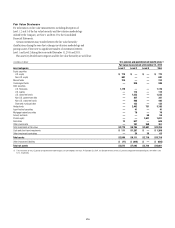
167
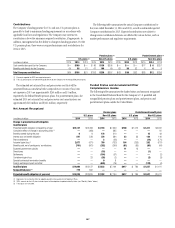
Contributions
The Company’s funding practice for U.S. and non-U.S. pension plans is
generally to fund to minimum funding requirements in accordance with
applicable local laws and regulations. The Company may increase its
contributions above the minimum required contribution, if appropriate. In
addition, management has the ability to change its funding practices. For the
U.S. pension plans, there were no required minimum cash contributions for
2014 or 2013.
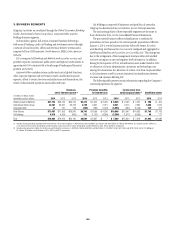
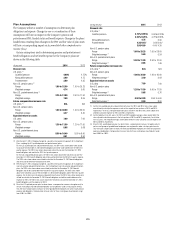
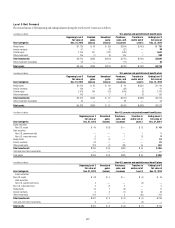
The following table summarizes the actual Company contributions for
the years ended December 31, 2014 and 2013, as well as estimated expected
Company contributions for 2015. Expected contributions are subject to
change since contribution decisions are affected by various factors, such as
market performance and regulatory requirements.
Pension plans (1) Postretirement plans (1)
U.S. plans (2) Non-U.S. plans U.S. plans Non-U.S. plans
In millions of dollars 2015 2014 2013 2015 2014 2013 2015 2014 2013 2015 2014 2013
Cash contributions paid by the Company $— $100 $— $ 86 $130 $308 $— $— $— $77 $ 6 $251
Benefits paid directly by the Company 60 58 51 47 100 49 63 56 52 6 65
Total Company contributions $60 $158 $51 $133 $230 $357 $63 $56 $52 $83 $12 $256
(1) Payments reported for 2015 are expected amounts.
(2) The U.S. pension plans include benefits paid directly by the Company for the nonqualified pension plans.
The estimated net actuarial loss and prior service cost that will be
amortized from Accumulated other comprehensive income (loss) into
net expense in 2015 are approximately $245 million and $1 million,
respectively, for defined benefit pension plans. For postretirement plans, the
estimated 2015 net actuarial loss and prior service cost amortizations are
approximately $45 million and $(12) million, respectively.
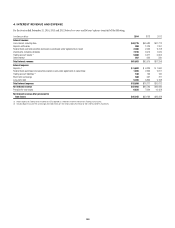
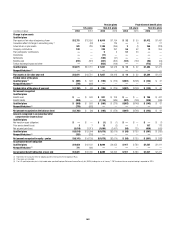
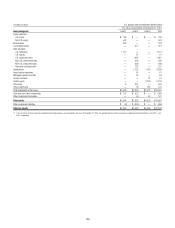
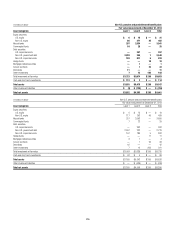
Funded Status and Accumulated Other
Comprehensive Income
The following table summarizes the funded status and amounts recognized
in the Consolidated Balance Sheet for the Company’s U.S. qualified and
nonqualified pension plans and postretirement plans, and pension and
postretirement plans outside the United States.
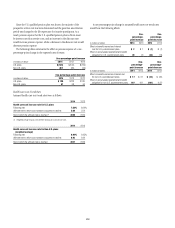
Net Amount Recognized
Pension plans Postretirement benefit plans
U.S. plans Non-U.S. plans U.S. plans Non-U.S. plans
In millions of dollars 2014 2013 2014 2013 2014 2013 2014 2013
Change in projected benefit obligation
Qualified plans
Projected benefit obligation at beginning of year $12,137 $13,268 $7,194 $7,399 $780 $1,072 $1,411 $2,002
Cumulative effect of change in accounting policy (1) —(368) —385 ———81
Benefits earned during the year 68178 210 ——15 43
Interest cost on benefit obligation 541 538 376 384 33 33 120 146
Plan amendments ——2(28) ——(14) (171)
Actuarial (gain) loss (2) 2,077 (671) 790 (733) 184 (253) 262 (617)
Benefits paid, net of participants’ contributions (701) (661) (352) (296) (91) (85) (93) (64)
Expected government subsidy ————11 13 ——
Divestitures ——(18) ———(1) —
Settlements ——(184) (57) ———(2)
Curtailment (gain) loss —23 (58) (2) ——(3) (3)
Special/contractual termination benefits ——98————
Foreign exchange impact and other ——(685) (76) ——(170) (4)
Qualified plans $14,060 $12,137 $7,252 $7,194 $917 $ 780 $1,527 $1,411
Nonqualified plans (3) 779 692 ——————
Projected benefit obligation at year end $14,839 $12,829 $7,252 $7,194 $917 $ 780 $1,527 $1,411
(1) Represents the cumulative effect of adopting quarterly remeasurement for Significant Plans.
(2) 2014 amounts for the U.S. plans include impact of the adoption of updated mortality tables (see “Mortality Tables” below).
(3) These plans are unfunded.