Citibank 2014 Annual Report Download - page 294
Download and view the complete annual report
Please find page 294 of the 2014 Citibank annual report below. You can navigate through the pages in the report by either clicking on the pages listed below, or by using the keyword search tool below to find specific information within the annual report.-
 1
1 -
2
-
3
-
4
-
5
-
6
-
7
-
8
-
9
-
10
-
11
-
12
-
13
-
14
-
15
-
16
-
17
-
18
-
19
-
20
-
21
-
22
-
23
-
24
-
25
-
26
-
27
-
28
-
29
-
30
-
31
-
32
-
33
-
34
-
35
-
36
-
37
-
38
-
39
-
40
-
41
-
42
-
43
-
44
-
45
-
46
-
47
-
48
-
49
-
50
-
51
-
52
-
53
-
54
-
55
-
56
-
57
-
58
-
59
-
60
-
61
-
62
-
63
-
64
-
65
-
66
-
67
-
68
-
69
-
70
-
71
-
72
-
73
-
74
-
75
-
76
-
77
-
78
-
79
-
80
-
81
-
82
-
83
-
84
-
85
-
86
-
87
-
88
-
89
-
90
-
91
-
92
-
93
-
94
-
95
-
96
-
97
-
98
-
99
-
100
-
101
-
102
-
103
-
104
-
105
-
106
-
107
-
108
-
109
-
110
-
111
-
112
-
113
-
114
-
115
-
116
-
117
-
118
-
119
-
120
-
121
-
122
-
123
-
124
-
125
-
126
-
127
-
128
-
129
-
130
-
131
-
132
-
133
-
134
-
135
-
136
-
137
-
138
-
139
-
140
-
141
-
142
-
143
-
144
-
145
-
146
-
147
-
148
-
149
-
150
-
151
-
152
-
153
-
154
-
155
-
156
-
157
-
158
-
159
-
160
-
161
-
162
-
163
-
164
-
165
-
166
-
167
-
168
-
169
-
170
-
171
-
172
-
173
-
174
-
175
-
176
-
177
-
178
-
179
-
180
-
181
-
182
-
183
-
184
-
185
-
186
-
187
-
188
-
189
-
190
-
191
-
192
-
193
-
194
-
195
-
196
-
197
-
198
-
199
-
200
-
201
-
202
-
203
-
204
-
205
-
206
-
207
-
208
-
209
-
210
-
211
-
212
-
213
-
214
-
215
-
216
-
217
-
218
-
219
-
220
-
221
-
222
-
223
-
224
-
225
-
226
-
227
-
228
-
229
-
230
-
231
-
232
-
233
-
234
-
235
-
236
-
237
-
238
-
239
-
240
-
241
-
242
-
243
-
244
-
245
-
246
-
247
-
248
-
249
-
250
-
251
-
252
-
253
-
254
-
255
-
256
-
257
-
258
-
259
-
260
-
261
-
262
-
263
-
264
-
265
-
266
-
267
-
268
-
269
-
270
-
271
-
272
-
273
-
274
-
275
-
276
-
277
-
278
-
279
-
280
-
281
-
282
-
283
-
 284
284 -
 285
285 -
 286
286 -
 287
287 -
 288
288 -
 289
289 -
 290
290 -
 291
291 -
 292
292 -
 293
293 -
 294
294 -
 295
295 -
 296
296 -
 297
297 -
 298
298 -
 299
299 -
 300
300 -
 301
301 -
 302
302 -
 303
303 -
 304
304 -
305
-
306
-
307
-
308
-
309
-
310
-
311
-
312
-
313
-
314
-
315
-
316
-
317
-
318
-
319
-
320
-
321
-
322
-
323
-
324
-
325
-
326
-
327
 |
 |

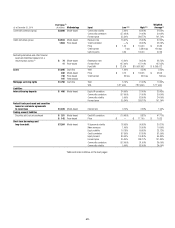
277
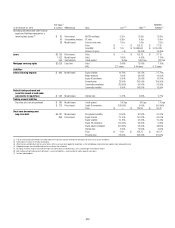
Fair Value (1) Weighted
average
As of December 31, 2013 (in millions) Methodology Input Low High (2)
Loans held-for-sale $912 Price-based Price (3) $ 60.00 $ 100.00 $ 98.77
393 Cash Flow Credit Spread 45 bps 80 bps 64 bps
Other real estate owned $ 98 Price-based Discount to price (4) 34.00% 59.00% 39.00%
17 Cash Flow Price (3) $ 60.46 $ 100.00 $ 96.67
Appraised Value 636,249 15,897,503 11,392,478
Loans (5) $581 Price-based Discount to price (4) 34.00% 39.00% 35.00%
109 Model-based Price (3) $ 52.40 $ 68.00 $ 65.32
Appraised Value 6,500,000 86,000,000 43,532,719
(1) The fair value amounts presented in this table represent the primary valuation technique or techniques for each class of assets or liabilities.
(2) Weighted averages are based on the fair value of the instrument.
(3) Prices are based on appraised values.
(4) Includes estimated costs to sell.
(5) Represents loans held for investment whose carrying amounts are based on the fair value of the underlying collateral.
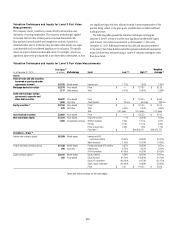
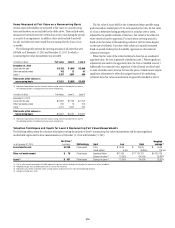
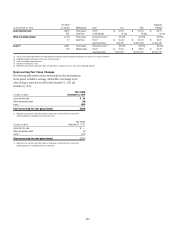
Nonrecurring Fair Value Changes
The following table presents total nonrecurring fair value measurements
for the period, included in earnings, attributable to the change in fair
value relating to assets that are still held at December 31, 2014 and
December 31, 2013:
In millions of dollars
Year ended
December 31, 2014
Loans held-for-sale $ 34
Other real estate owned (16)
Loans (1) (533)
Total nonrecurring fair value gains (losses) $(515)
(1) Represents loans held for investment whose carrying amount is based on the fair value of the
underlying collateral, including primarily real-estate loans.
In millions of dollars
Year ended
December 31, 2013
Loans held-for-sale $ —
Other real estate owned (6)
Loans (1) (761)
Total nonrecurring fair value gains (losses) $(767)
(1) Represents loans held for investment whose carrying amount is based on the fair value of the
underlying collateral, including primarily real-estate loans.