Citibank 2014 Annual Report Download - page 70
Download and view the complete annual report
Please find page 70 of the 2014 Citibank annual report below. You can navigate through the pages in the report by either clicking on the pages listed below, or by using the keyword search tool below to find specific information within the annual report.-
 1
1 -
2
-
3
-
4
-
5
-
6
-
7
-
8
-
9
-
10
-
11
-
12
-
13
-
14
-
15
-
16
-
17
-
18
-
19
-
20
-
21
-
22
-
23
-
24
-
25
-
26
-
27
-
28
-
29
-
30
-
31
-
32
-
33
-
34
-
35
-
36
-
37
-
38
-
39
-
40
-
41
-
42
-
43
-
44
-
45
-
46
-
47
-
48
-
49
-
50
-
51
-
52
-
53
-
54
-
55
-
56
-
57
-
58
-
59
-
 60
60 -
 61
61 -
 62
62 -
 63
63 -
 64
64 -
 65
65 -
 66
66 -
 67
67 -
 68
68 -
 69
69 -
 70
70 -
 71
71 -
 72
72 -
 73
73 -
 74
74 -
 75
75 -
 76
76 -
 77
77 -
 78
78 -
 79
79 -
 80
80 -
81
-
82
-
83
-
84
-
85
-
86
-
87
-
88
-
89
-
90
-
91
-
92
-
93
-
94
-
95
-
96
-
97
-
98
-
99
-
100
-
101
-
102
-
103
-
104
-
105
-
106
-
107
-
108
-
109
-
110
-
111
-
112
-
113
-
114
-
115
-
116
-
117
-
118
-
119
-
120
-
121
-
122
-
123
-
124
-
125
-
126
-
127
-
128
-
129
-
130
-
131
-
132
-
133
-
134
-
135
-
136
-
137
-
138
-
139
-
140
-
141
-
142
-
143
-
144
-
145
-
146
-
147
-
148
-
149
-
150
-
151
-
152
-
153
-
154
-
155
-
156
-
157
-
158
-
159
-
160
-
161
-
162
-
163
-
164
-
165
-
166
-
167
-
168
-
169
-
170
-
171
-
172
-
173
-
174
-
175
-
176
-
177
-
178
-
179
-
180
-
181
-
182
-
183
-
184
-
185
-
186
-
187
-
188
-
189
-
190
-
191
-
192
-
193
-
194
-
195
-
196
-
197
-
198
-
199
-
200
-
201
-
202
-
203
-
204
-
205
-
206
-
207
-
208
-
209
-
210
-
211
-
212
-
213
-
214
-
215
-
216
-
217
-
218
-
219
-
220
-
221
-
222
-
223
-
224
-
225
-
226
-
227
-
228
-
229
-
230
-
231
-
232
-
233
-
234
-
235
-
236
-
237
-
238
-
239
-
240
-
241
-
242
-
243
-
244
-
245
-
246
-
247
-
248
-
249
-
250
-
251
-
252
-
253
-
254
-
255
-
256
-
257
-
258
-
259
-
260
-
261
-
262
-
263
-
264
-
265
-
266
-
267
-
268
-
269
-
270
-
271
-
272
-
273
-
274
-
275
-
276
-
277
-
278
-
279
-
280
-
281
-
282
-
283
-
284
-
285
-
286
-
287
-
288
-
289
-
290
-
291
-
292
-
293
-
294
-
295
-
296
-
297
-
298
-
299
-
300
-
301
-
302
-
303
-
304
-
305
-
306
-
307
-
308
-
309
-
310
-
311
-
312
-
313
-
314
-
315
-
316
-
317
-
318
-
319
-
320
-
321
-
322
-
323
-
324
-
325
-
326
-
327
 |
 |
53
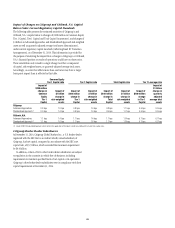
Regulatory Capital Standards Developments
GSIB Surcharge
In December 2014, the Federal Reserve Board issued a notice of proposed
rulemaking which would impose risk-based capital surcharges upon
U.S. bank holding companies that are identified as GSIBs, including Citi.
Under the Federal Reserve Board’s proposed rule, consistent with the Basel
Committee’s methodology, identification as a GSIB would be based primarily
on quantitative measurement indicators underlying five equally weighted
broad categories of systemic importance: (i) size, (ii) interconnectedness,
(iii) cross-jurisdictional activity, (iv) substitutability, and (v) complexity.
With the exception of size, each of the other categories are comprised of
multiple indicators also of equal weight, and amounting to 12 indicators
in total.
A U.S. banking organization that is designated a GSIB under the proposed
methodology would calculate a surcharge using two methods and would
be subject to the higher of the resulting two surcharges. The first method
(“method 1”) would be based on the same five broad categories of systemic
importance used to identify a GSIB, whereas under the second method
(“method 2”) the substitutability indicator would be replaced with a measure
intended to assess the extent of a GSIB’s reliance on short-term wholesale
funding. As proposed, given that the calculation under method 2 involves, in
part, the doubling of the indicator scores related to size, interconnectedness,
cross-jurisdictional activity and complexity, method 2 would generally result
in higher surcharges as compared to method 1.
Estimated GSIB surcharges under the proposed rule, which would be
required to be comprised entirely of Common Equity Tier 1 Capital, would
initially range from 1.0% to 4.5% of total risk-weighted assets. Moreover, the
GSIB surcharge would be an extension of the Capital Conservation Buffer
and, if invoked, any Countercyclical Capital Buffer, and would result in
restrictions on earnings distributions (e.g., dividends, equity repurchases,
and discretionary executive bonuses) should the surcharge be drawn upon to
absorb losses during periods of financial or economic stress, with the degree
of such restrictions based upon the extent to which the surcharge is drawn.
Under the proposal, like that of the Basel Committee’s rule, the GSIB
surcharge would be introduced in parallel with the Capital Conservation
Buffer and, if applicable, any Countercyclical Capital Buffer, commencing
phase-in on January 1, 2016 and becoming fully effective on January 1, 2019.
As of December 31, 2014, Citi estimates its GSIB surcharge under the
Federal Reserve Board’s proposal would be 4%, compared to at least 2% under
the Basel Committee requirements.
For additional information regarding the Federal Reserve Board’s GSIB
surcharge proposal, as well as the Financial Stability Board’s total loss-
absorbing capacity, or TLAC, consultative document, see “Risk Factors—
Regulatory Risks” and “Managing Global Risk—Market Risk—Funding
and Liquidity Risk” below.
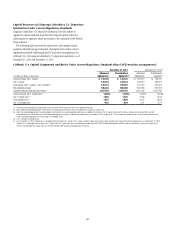
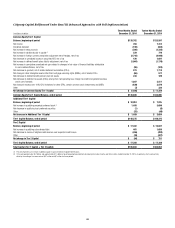
Tangible Common Equity, Tangible Book Value Per Share
and Book Value Per Share
Tangible common equity (TCE), as currently defined by Citi, represents
common equity less goodwill and other intangible assets (other than MSRs).
Other companies may calculate TCE in a different manner. TCE and tangible
book value per share are non-GAAP financial measures. Citi believes these
capital metrics provide useful information, as they are used by investors and
industry analysts.
In millions of dollars or shares, except per share amounts
December 31,
2014
December 31,
2013
Total Citigroup stockholders’ equity $210,534 $204,339
Less: Preferred stock 10,468 6,738
Common equity $200,066 $197,601
Less: Intangible assets:
Goodwill 23,592 25,009
Other intangible assets (other than MSRs) 4,566 5,056
Goodwill related to assets held-for-sale 71 —
Tangible common equity (TCE) $171,837 $167,536
Common shares outstanding (CSO) 3,023.9 3,029.2
Tangible book value per share (TCE/CSO) $ 56.83 $ 55.31
Book value per share (common equity/CSO) $ 66.16 $ 65.23