Citibank 2014 Annual Report Download - page 102
Download and view the complete annual report
Please find page 102 of the 2014 Citibank annual report below. You can navigate through the pages in the report by either clicking on the pages listed below, or by using the keyword search tool below to find specific information within the annual report.-
 1
1 -
2
-
3
-
4
-
5
-
6
-
7
-
8
-
9
-
10
-
11
-
12
-
13
-
14
-
15
-
16
-
17
-
18
-
19
-
20
-
21
-
22
-
23
-
24
-
25
-
26
-
27
-
28
-
29
-
30
-
31
-
32
-
33
-
34
-
35
-
36
-
37
-
38
-
39
-
40
-
41
-
42
-
43
-
44
-
45
-
46
-
47
-
48
-
49
-
50
-
51
-
52
-
53
-
54
-
55
-
56
-
57
-
58
-
59
-
60
-
61
-
62
-
63
-
64
-
65
-
66
-
67
-
68
-
69
-
70
-
71
-
72
-
73
-
74
-
75
-
76
-
77
-
78
-
79
-
80
-
81
-
82
-
83
-
84
-
85
-
86
-
87
-
88
-
89
-
90
-
91
-
 92
92 -
 93
93 -
 94
94 -
 95
95 -
 96
96 -
 97
97 -
 98
98 -
 99
99 -
 100
100 -
 101
101 -
 102
102 -
 103
103 -
 104
104 -
 105
105 -
 106
106 -
 107
107 -
 108
108 -
 109
109 -
 110
110 -
 111
111 -
 112
112 -
113
-
114
-
115
-
116
-
117
-
118
-
119
-
120
-
121
-
122
-
123
-
124
-
125
-
126
-
127
-
128
-
129
-
130
-
131
-
132
-
133
-
134
-
135
-
136
-
137
-
138
-
139
-
140
-
141
-
142
-
143
-
144
-
145
-
146
-
147
-
148
-
149
-
150
-
151
-
152
-
153
-
154
-
155
-
156
-
157
-
158
-
159
-
160
-
161
-
162
-
163
-
164
-
165
-
166
-
167
-
168
-
169
-
170
-
171
-
172
-
173
-
174
-
175
-
176
-
177
-
178
-
179
-
180
-
181
-
182
-
183
-
184
-
185
-
186
-
187
-
188
-
189
-
190
-
191
-
192
-
193
-
194
-
195
-
196
-
197
-
198
-
199
-
200
-
201
-
202
-
203
-
204
-
205
-
206
-
207
-
208
-
209
-
210
-
211
-
212
-
213
-
214
-
215
-
216
-
217
-
218
-
219
-
220
-
221
-
222
-
223
-
224
-
225
-
226
-
227
-
228
-
229
-
230
-
231
-
232
-
233
-
234
-
235
-
236
-
237
-
238
-
239
-
240
-
241
-
242
-
243
-
244
-
245
-
246
-
247
-
248
-
249
-
250
-
251
-
252
-
253
-
254
-
255
-
256
-
257
-
258
-
259
-
260
-
261
-
262
-
263
-
264
-
265
-
266
-
267
-
268
-
269
-
270
-
271
-
272
-
273
-
274
-
275
-
276
-
277
-
278
-
279
-
280
-
281
-
282
-
283
-
284
-
285
-
286
-
287
-
288
-
289
-
290
-
291
-
292
-
293
-
294
-
295
-
296
-
297
-
298
-
299
-
300
-
301
-
302
-
303
-
304
-
305
-
306
-
307
-
308
-
309
-
310
-
311
-
312
-
313
-
314
-
315
-
316
-
317
-
318
-
319
-
320
-
321
-
322
-
323
-
324
-
325
-
326
-
327
 |
 |
85
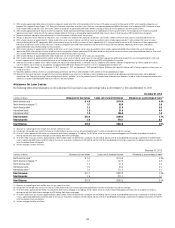
Based on the limited number of Revolving HELOCs that have begun
amortization as of December 31, 2014, approximately 6.4% of the amortizing
home equity loans were 30+ days past due, compared to 2.7% of the total
outstanding home equity loan portfolio (amortizing and non-amortizing).
This compared to 6.0% and 2.8%, respectively, as of December 31, 2013.
However, these resets have generally occurred during a period of historically
low interest rates, which Citi believes has likely reduced the overall “payment
shock” to the borrower.
Citi continues to monitor this reset risk closely and will continue to consider
any potential impact in determining its allowance for loan loss reserves. In
addition, management continues to review and take additional actions to offset
potential reset risk, such as establishment of a borrower outreach program to
provide reset risk education, establishment of a reset risk mitigation unit and
proactively contacting high-risk borrowers. For further information on reset
risk, see “Risk Factors—Credit and Market Risks” above.
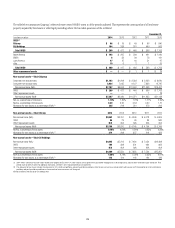
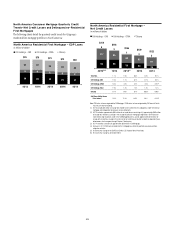
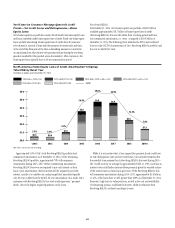
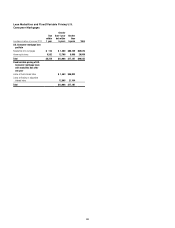
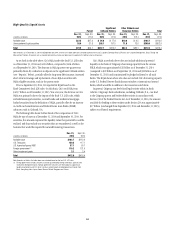
Net Credit Losses and Delinquencies
The following charts detail the quarterly credit trends for Citi’s home equity
loan portfolio in North America.
4Q’143Q’142Q’141Q’144Q’13
29
3
28
3
27
3
26
3
25
3
North America Home Equity — EOP Loans
In billions of dollars
Citi Holdings Citicorp
$32 $31 $30 $28
$29
4Q’143Q’142Q’141Q’144Q’13(1)(2)
169
3
140
2
114
3
98
2
87
1
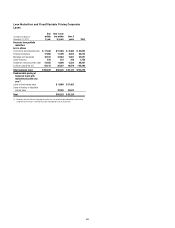
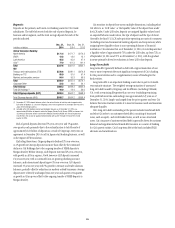
North America Home Equity — Net Credit Losses
In millions of dollars
Citi Holdings Citicorp
$173
$143
$117
$88
$100
Total NCL 2.1% 1.9% 1.5% 1.3% 1.2%
Citi Holdings 2.3% 2.0% 1.7% 1.5% 1.4%
Citicorp 0.5% 0.3% 0.4% 0.3% 0.2%
Note: Totals may not sum due to rounding.
(1) 4Q’13 includes $15 million of charge-offs related to Citi’s fulfillment of its obligations under the
national mortgage and independent foreclosure review settlements.
(2) 4Q’13 excludes approximately $100 million of net credit losses consisting of (i) approximately
$64 million for the acceleration of accounting losses associated with modified home equity loans
determined to be collateral dependent, (ii) approximately $22 million of charge-offs related to a
change in the charge-off policy for mortgages originated in CitiFinancial to more closely align to
policies used in the CitiMortgage business, and (iii) approximately $14 million of charge-offs related
to a change in the estimate of net credit losses related to collateral dependent loans to borrowers that
have gone through Chapter 7 bankruptcy.
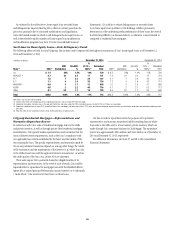
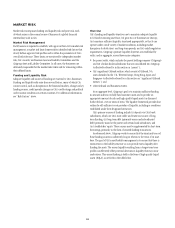
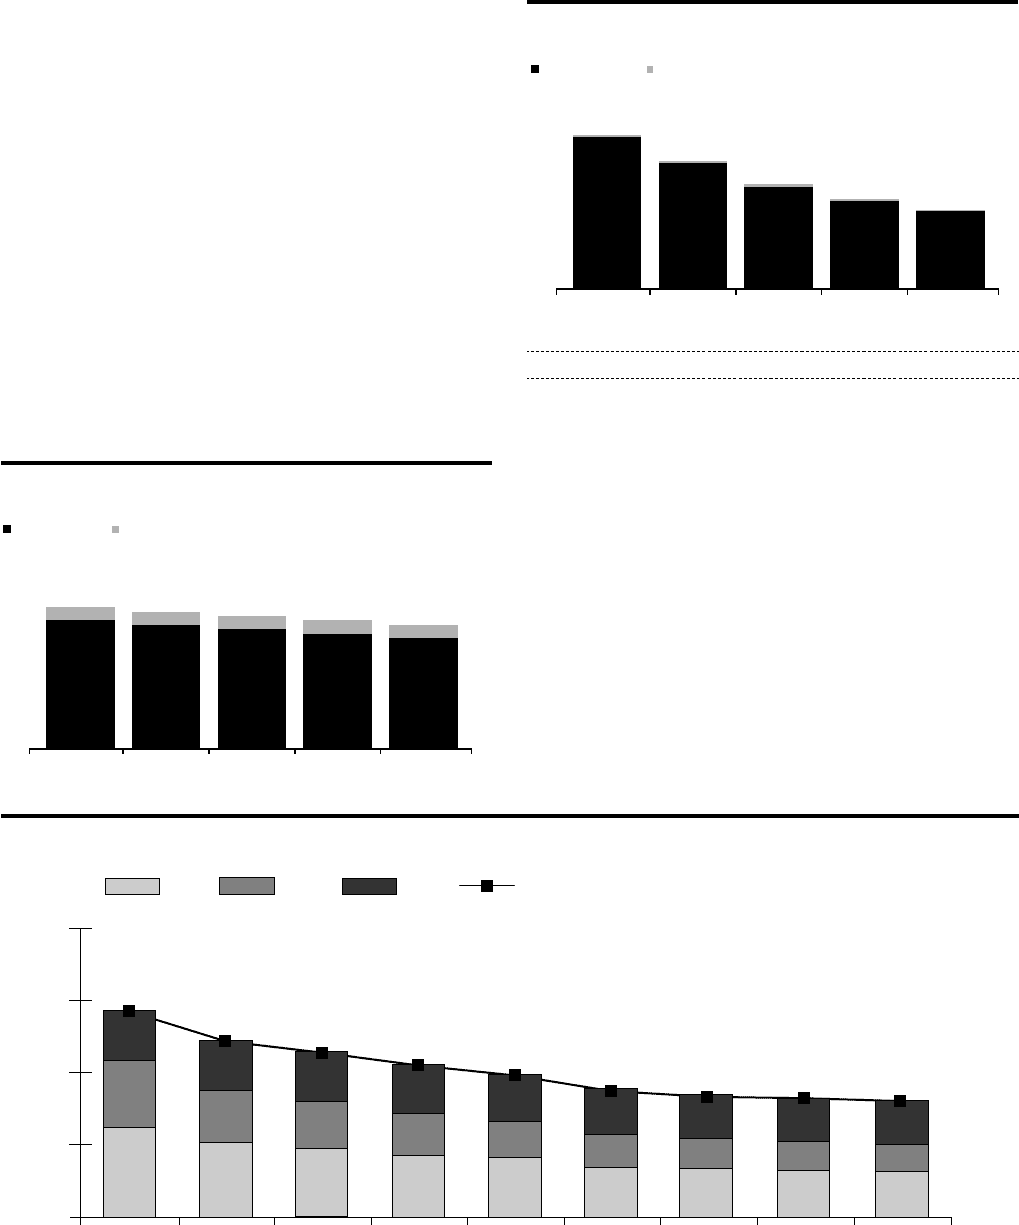
North America Home Equity Loan Delinquencies — Citi Holdings
In billions of dollars
Days Past Due: 30+ DPD180+90-17930-89
0.0
0.5
1.0
1.5
2.0
4Q’143Q’142Q’141Q’144Q’133Q’132Q’131Q’134Q’12
0.63 0.52 0.48 0.43 0.42 0.35 0.34 0.33 0.32
0.47
0.37 0.33 0.30 0.25 0.23 0.21 0.20 0.19
0.35
0.35 0.35 0.34 0.33 0.32 0.31 0.31
0.30
1.45
1.24 1.16 1.07 1.00 0.89 0.85 0.84 0.82
Note: Totals may not sum due to rounding.