Citibank 2014 Annual Report Download - page 283
Download and view the complete annual report
Please find page 283 of the 2014 Citibank annual report below. You can navigate through the pages in the report by either clicking on the pages listed below, or by using the keyword search tool below to find specific information within the annual report.-
 1
1 -
2
-
3
-
4
-
5
-
6
-
7
-
8
-
9
-
10
-
11
-
12
-
13
-
14
-
15
-
16
-
17
-
18
-
19
-
20
-
21
-
22
-
23
-
24
-
25
-
26
-
27
-
28
-
29
-
30
-
31
-
32
-
33
-
34
-
35
-
36
-
37
-
38
-
39
-
40
-
41
-
42
-
43
-
44
-
45
-
46
-
47
-
48
-
49
-
50
-
51
-
52
-
53
-
54
-
55
-
56
-
57
-
58
-
59
-
60
-
61
-
62
-
63
-
64
-
65
-
66
-
67
-
68
-
69
-
70
-
71
-
72
-
73
-
74
-
75
-
76
-
77
-
78
-
79
-
80
-
81
-
82
-
83
-
84
-
85
-
86
-
87
-
88
-
89
-
90
-
91
-
92
-
93
-
94
-
95
-
96
-
97
-
98
-
99
-
100
-
101
-
102
-
103
-
104
-
105
-
106
-
107
-
108
-
109
-
110
-
111
-
112
-
113
-
114
-
115
-
116
-
117
-
118
-
119
-
120
-
121
-
122
-
123
-
124
-
125
-
126
-
127
-
128
-
129
-
130
-
131
-
132
-
133
-
134
-
135
-
136
-
137
-
138
-
139
-
140
-
141
-
142
-
143
-
144
-
145
-
146
-
147
-
148
-
149
-
150
-
151
-
152
-
153
-
154
-
155
-
156
-
157
-
158
-
159
-
160
-
161
-
162
-
163
-
164
-
165
-
166
-
167
-
168
-
169
-
170
-
171
-
172
-
173
-
174
-
175
-
176
-
177
-
178
-
179
-
180
-
181
-
182
-
183
-
184
-
185
-
186
-
187
-
188
-
189
-
190
-
191
-
192
-
193
-
194
-
195
-
196
-
197
-
198
-
199
-
200
-
201
-
202
-
203
-
204
-
205
-
206
-
207
-
208
-
209
-
210
-
211
-
212
-
213
-
214
-
215
-
216
-
217
-
218
-
219
-
220
-
221
-
222
-
223
-
224
-
225
-
226
-
227
-
228
-
229
-
230
-
231
-
232
-
233
-
234
-
235
-
236
-
237
-
238
-
239
-
240
-
241
-
242
-
243
-
244
-
245
-
246
-
247
-
248
-
249
-
250
-
251
-
252
-
253
-
254
-
255
-
256
-
257
-
258
-
259
-
260
-
261
-
262
-
263
-
264
-
265
-
266
-
267
-
268
-
269
-
270
-
271
-
272
-
 273
273 -
 274
274 -
 275
275 -
 276
276 -
 277
277 -
 278
278 -
 279
279 -
 280
280 -
 281
281 -
 282
282 -
 283
283 -
 284
284 -
 285
285 -
 286
286 -
 287
287 -
 288
288 -
 289
289 -
 290
290 -
 291
291 -
 292
292 -
 293
293 -
294
-
295
-
296
-
297
-
298
-
299
-
300
-
301
-
302
-
303
-
304
-
305
-
306
-
307
-
308
-
309
-
310
-
311
-
312
-
313
-
314
-
315
-
316
-
317
-
318
-
319
-
320
-
321
-
322
-
323
-
324
-
325
-
326
-
327
 |
 |

266
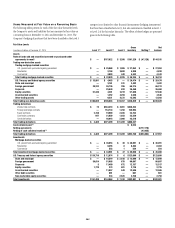
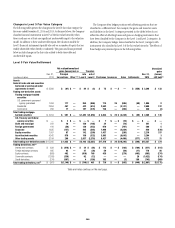
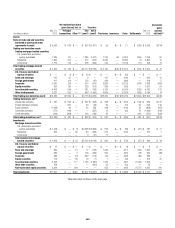
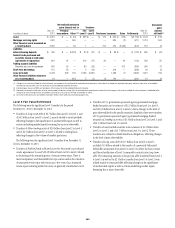
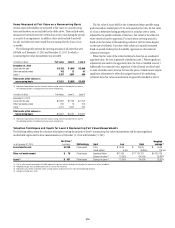
Changes in Level 3 Fair Value Category
The following tables present the changes in the Level 3 fair value category for
the years ended December 31, 2014 and 2013. As discussed above, the Company
classifies financial instruments as Level 3 of the fair value hierarchy when
there is reliance on at least one significant unobservable input to the valuation
model. In addition to these unobservable inputs, the valuation models for
Level 3 financial instruments typically also rely on a number of inputs that are
readily observable either directly or indirectly. The gains and losses presented
below include changes in the fair value related to both observable and
unobservable inputs.
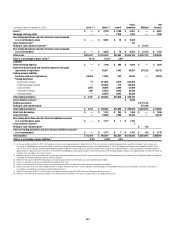
The Company often hedges positions with offsetting positions that are
classified in a different level. For example, the gains and losses for assets
and liabilities in the Level 3 category presented in the tables below do not
reflect the effect of offsetting losses and gains on hedging instruments that
have been classified by the Company in the Level 1 and Level 2 categories. In
addition, the Company hedges items classified in the Level 3 category with
instruments also classified in Level 3 of the fair value hierarchy. The effects of
these hedges are presented gross in the following tables.
Level 3 Fair Value Rollforward
In millions of dollars
Dec. 31,
2013
Net realized/unrealized
gains (losses) incl. in Transfers
Purchases Issuances Sales Settlements
Dec. 31,
2014
Unrealized
gains
(losses)
still held (3)
Principal
transactions Other (1)(2)
into
Level 3
out of
Level 3
Assets
Federal funds sold and securities
borrowed or purchased under
agreements to resell $ 3,566 $ (61) $ — $ 84 $ (8) $ 75 $ — $ — $ (258) $ 3,398 $ 133
Trading non-derivative assets
Trading mortgage-backed
securities
U.S. government-sponsored
agency guaranteed 1,094 117 — 854 (966) 714 26 (695) (59) 1,085 8
Residential 2,854 457 — 442 (514) 2,582 — (3,141) — 2,680 132
Commercial 256 17 — 187 (376) 758 — (402) — 440 (4)
Total trading mortgage-
backed securities $ 4,204 $ 591 $ — $ 1,483 $(1,856) $ 4,054 $ 26 $ (4,238) $ (59) $ 4,205 $ 136
U.S. Treasury and federal
agency securities $ — $ 3 $ — $ — $ — $ 7 $ — $ (10) $ — $ — $ —
State and municipal 222 10 — 150 (105) 34 — (70) — 241 1
Foreign government 416 (56) — 130 (253) 676 — (707) — 206 5
Corporate 1,835 (127) — 465 (502) 1,988 — (2,839) — 820 (139)
Equity securities 1,057 87 — 142 (209) 1,437 — (295) — 2,219 337
Asset-backed securities 4,342 876 — 158 (332) 3,893 — (5,643) — 3,294 3
Other trading assets 3,184 269 — 2,637 (2,278) 5,427 — (4,490) (377) 4,372 31
Total trading non-derivative assets $15,260 $ 1,653 $ — $5,165 $(5,535) $17,478 $ 26 $(18,292) $ (398) $15,357 $ 374
Trading derivatives, net (4)
Interest rate contracts $ 839 $ (818) $ — $ 24 $ (98) $ 113 $ — $ (162) $ (109) $ (211) $ (414)
Foreign exchange contracts 695 92 — 47 (39) 59 — (59) (17) 778 56
Equity contracts (858) 482 — (916) 766 435 — (279) (493) (863) (274)
Commodity contracts (1,393) (338) — 92 (12) — — — 29 (1,622) (174)
Credit derivatives (274) (567) — 4 (156) 103 — (3) 150 (743) (369)
Total trading derivatives, net (4) $ (991) $(1,149) $ — $ (749) $ 461 $ 710 $ — $ (503) $ (440) $ (2,661) $(1,175)
Table and notes continue on the next page.