Citibank 2014 Annual Report Download - page 153
Download and view the complete annual report
Please find page 153 of the 2014 Citibank annual report below. You can navigate through the pages in the report by either clicking on the pages listed below, or by using the keyword search tool below to find specific information within the annual report.-
 1
1 -
2
-
3
-
4
-
5
-
6
-
7
-
8
-
9
-
10
-
11
-
12
-
13
-
14
-
15
-
16
-
17
-
18
-
19
-
20
-
21
-
22
-
23
-
24
-
25
-
26
-
27
-
28
-
29
-
30
-
31
-
32
-
33
-
34
-
35
-
36
-
37
-
38
-
39
-
40
-
41
-
42
-
43
-
44
-
45
-
46
-
47
-
48
-
49
-
50
-
51
-
52
-
53
-
54
-
55
-
56
-
57
-
58
-
59
-
60
-
61
-
62
-
63
-
64
-
65
-
66
-
67
-
68
-
69
-
70
-
71
-
72
-
73
-
74
-
75
-
76
-
77
-
78
-
79
-
80
-
81
-
82
-
83
-
84
-
85
-
86
-
87
-
88
-
89
-
90
-
91
-
92
-
93
-
94
-
95
-
96
-
97
-
98
-
99
-
100
-
101
-
102
-
103
-
104
-
105
-
106
-
107
-
108
-
109
-
110
-
111
-
112
-
113
-
114
-
115
-
116
-
117
-
118
-
119
-
120
-
121
-
122
-
123
-
124
-
125
-
126
-
127
-
128
-
129
-
130
-
131
-
132
-
133
-
134
-
135
-
136
-
137
-
138
-
139
-
140
-
141
-
142
-
 143
143 -
 144
144 -
 145
145 -
 146
146 -
 147
147 -
 148
148 -
 149
149 -
 150
150 -
 151
151 -
 152
152 -
 153
153 -
 154
154 -
 155
155 -
 156
156 -
 157
157 -
 158
158 -
 159
159 -
 160
160 -
 161
161 -
 162
162 -
 163
163 -
164
-
165
-
166
-
167
-
168
-
169
-
170
-
171
-
172
-
173
-
174
-
175
-
176
-
177
-
178
-
179
-
180
-
181
-
182
-
183
-
184
-
185
-
186
-
187
-
188
-
189
-
190
-
191
-
192
-
193
-
194
-
195
-
196
-
197
-
198
-
199
-
200
-
201
-
202
-
203
-
204
-
205
-
206
-
207
-
208
-
209
-
210
-
211
-
212
-
213
-
214
-
215
-
216
-
217
-
218
-
219
-
220
-
221
-
222
-
223
-
224
-
225
-
226
-
227
-
228
-
229
-
230
-
231
-
232
-
233
-
234
-
235
-
236
-
237
-
238
-
239
-
240
-
241
-
242
-
243
-
244
-
245
-
246
-
247
-
248
-
249
-
250
-
251
-
252
-
253
-
254
-
255
-
256
-
257
-
258
-
259
-
260
-
261
-
262
-
263
-
264
-
265
-
266
-
267
-
268
-
269
-
270
-
271
-
272
-
273
-
274
-
275
-
276
-
277
-
278
-
279
-
280
-
281
-
282
-
283
-
284
-
285
-
286
-
287
-
288
-
289
-
290
-
291
-
292
-
293
-
294
-
295
-
296
-
297
-
298
-
299
-
300
-
301
-
302
-
303
-
304
-
305
-
306
-
307
-
308
-
309
-
310
-
311
-
312
-
313
-
314
-
315
-
316
-
317
-
318
-
319
-
320
-
321
-
322
-
323
-
324
-
325
-
326
-
327
 |
 |
136
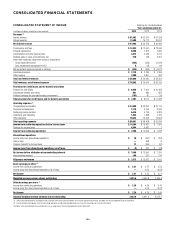
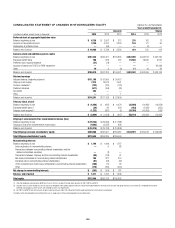
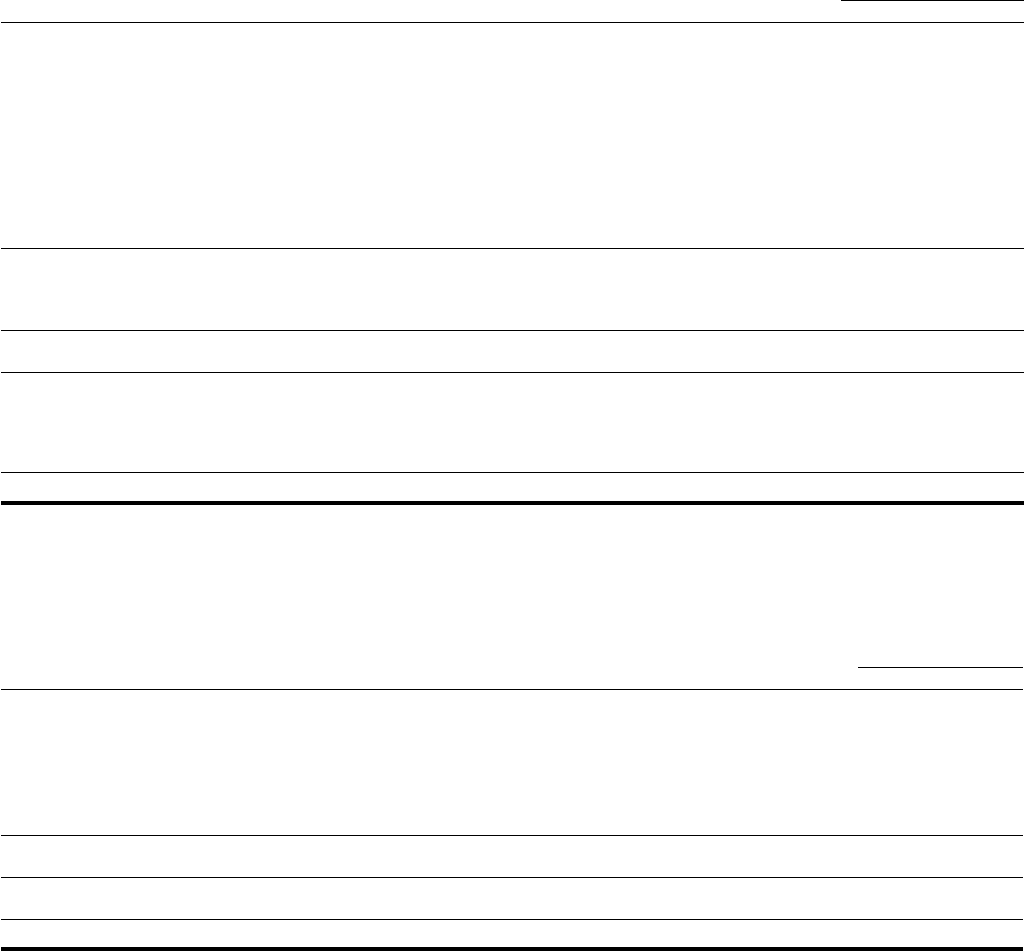
CONSOLIDATED BALANCE SHEET Citigroup Inc. and Subsidiaries
December 31,
In millions of dollars 2014 2013
Assets
Cash and due from banks (including segregated cash and other deposits) $ 32,108 $ 29,885
Deposits with banks 128,089 169,005
Federal funds sold and securities borrowed or purchased under agreements to resell (including $144,191 and
$144,083 as of December 31, 2014 and December 31, 2013, respectively, at fair value) 242,570 257,037
Brokerage receivables 28,419 25,674
Trading account assets (including $106,217 and $106,695 pledged to creditors at December 31, 2014 and December 31, 2013, respectively) 296,786 285,928
Investments:
Available for Sale (including $13,808 and $22,258 pledged to creditors as of December 31, 2014 and December 31, 2013, respectively) 300,143 286,511
Held to Maturity (including $2,974 and $4,730 pledged to creditors as of December 31, 2014 and December 31, 2013, respectively) 23,921 10,599
Non-Marketable Equity Securities (including $2,758 and $4,705 at fair value as of December 31, 2014 and December 31, 2013 respectively) 9,379 11,870
Total investments $ 333,443 $ 308,980
Loans:
Consumer (including $43 and $957 as of December 31, 2014 and December 31, 2013, respectively, at fair value) 369,970 393,831
Corporate (including $5,858 and $4,072 as of December 31, 2014 and December 31, 2013, respectively, at fair value) 274,665 271,641
Loans, net of unearned income $ 644,635 $ 665,472
Allowance for loan losses (15,994) (19,648)
Total loans, net $ 628,641 $ 645,824
Goodwill 23,592 25,009
Intangible assets (other than MSRs) 4,566 5,056
Mortgage servicing rights (MSRs) 1,845 2,718
Other assets (including $7,762 and $7,123 as of December 31, 2014 and December 31, 2013, respectively, at fair value) 122,471 125,266
Total assets $1,842,530 $1,880,382
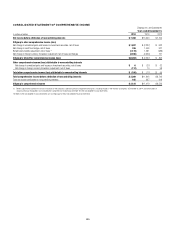
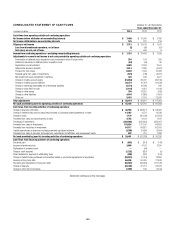
The following table presents certain assets of consolidated variable interest entities (VIEs), which are included in the Consolidated Balance Sheet above. The
assets in the table below include those assets that can only be used to settle obligations of consolidated VIEs, presented on the following page, and are in excess
of those obligations. Additionally, the assets in the table below include third-party assets of consolidated VIEs only and exclude intercompany balances that
eliminate in consolidation.
December 31,
In millions of dollars 2014 2013
Assets of consolidated VIEs to be used to settle obligations of consolidated VIEs
Cash and due from banks $ 300 $ 362
Trading account assets 671 977
Investments 8,014 10,950
Loans, net of unearned income
Consumer (including $0 and $910 as of December 31, 2014 and December 31, 2013, respectively, at fair value) 66,383 63,493
Corporate (including $0 and $14 as of December 31, 2014 and December 31, 2013, respectively, at fair value) 29,596 31,919
Loans, net of unearned income $ 95,979 $ 95,412
Allowance for loan losses (2,793) (3,502)
Total loans, net $ 93,186 $ 91,910
Other assets 619 1,234
Total assets of consolidated VIEs to be used to settle obligations of consolidated VIEs $102,790 $105,433
Statement continues on the next page.