Citibank 2014 Annual Report Download - page 168
Download and view the complete annual report
Please find page 168 of the 2014 Citibank annual report below. You can navigate through the pages in the report by either clicking on the pages listed below, or by using the keyword search tool below to find specific information within the annual report.-
 1
1 -
2
-
3
-
4
-
5
-
6
-
7
-
8
-
9
-
10
-
11
-
12
-
13
-
14
-
15
-
16
-
17
-
18
-
19
-
20
-
21
-
22
-
23
-
24
-
25
-
26
-
27
-
28
-
29
-
30
-
31
-
32
-
33
-
34
-
35
-
36
-
37
-
38
-
39
-
40
-
41
-
42
-
43
-
44
-
45
-
46
-
47
-
48
-
49
-
50
-
51
-
52
-
53
-
54
-
55
-
56
-
57
-
58
-
59
-
60
-
61
-
62
-
63
-
64
-
65
-
66
-
67
-
68
-
69
-
70
-
71
-
72
-
73
-
74
-
75
-
76
-
77
-
78
-
79
-
80
-
81
-
82
-
83
-
84
-
85
-
86
-
87
-
88
-
89
-
90
-
91
-
92
-
93
-
94
-
95
-
96
-
97
-
98
-
99
-
100
-
101
-
102
-
103
-
104
-
105
-
106
-
107
-
108
-
109
-
110
-
111
-
112
-
113
-
114
-
115
-
116
-
117
-
118
-
119
-
120
-
121
-
122
-
123
-
124
-
125
-
126
-
127
-
128
-
129
-
130
-
131
-
132
-
133
-
134
-
135
-
136
-
137
-
138
-
139
-
140
-
141
-
142
-
143
-
144
-
145
-
146
-
147
-
148
-
149
-
150
-
151
-
152
-
153
-
154
-
155
-
156
-
157
-
 158
158 -
 159
159 -
 160
160 -
 161
161 -
 162
162 -
 163
163 -
 164
164 -
 165
165 -
 166
166 -
 167
167 -
 168
168 -
 169
169 -
 170
170 -
 171
171 -
 172
172 -
 173
173 -
 174
174 -
 175
175 -
 176
176 -
 177
177 -
 178
178 -
179
-
180
-
181
-
182
-
183
-
184
-
185
-
186
-
187
-
188
-
189
-
190
-
191
-
192
-
193
-
194
-
195
-
196
-
197
-
198
-
199
-
200
-
201
-
202
-
203
-
204
-
205
-
206
-
207
-
208
-
209
-
210
-
211
-
212
-
213
-
214
-
215
-
216
-
217
-
218
-
219
-
220
-
221
-
222
-
223
-
224
-
225
-
226
-
227
-
228
-
229
-
230
-
231
-
232
-
233
-
234
-
235
-
236
-
237
-
238
-
239
-
240
-
241
-
242
-
243
-
244
-
245
-
246
-
247
-
248
-
249
-
250
-
251
-
252
-
253
-
254
-
255
-
256
-
257
-
258
-
259
-
260
-
261
-
262
-
263
-
264
-
265
-
266
-
267
-
268
-
269
-
270
-
271
-
272
-
273
-
274
-
275
-
276
-
277
-
278
-
279
-
280
-
281
-
282
-
283
-
284
-
285
-
286
-
287
-
288
-
289
-
290
-
291
-
292
-
293
-
294
-
295
-
296
-
297
-
298
-
299
-
300
-
301
-
302
-
303
-
304
-
305
-
306
-
307
-
308
-
309
-
310
-
311
-
312
-
313
-
314
-
315
-
316
-
317
-
318
-
319
-
320
-
321
-
322
-
323
-
324
-
325
-
326
-
327
 |
 |
151
Earnings per Share
Earnings per share (EPS) is computed after deducting preferred stock
dividends. The Company has granted restricted and deferred share awards
with dividend rights that are considered to be participating securities,
which are akin to a second class of common stock. Accordingly, a portion
of Citigroup’s earnings is allocated to those participating securities in the
EPS calculation.
Basic earnings per share is computed by dividing income available to
common stockholders after the allocation of dividends and undistributed
earnings to the participating securities by the weighted average number
of common shares outstanding for the period. Diluted earnings per share
reflects the potential dilution that could occur if securities or other contracts
to issue common stock were exercised. It is computed after giving
consideration to the weighted average dilutive effect of the Company’s stock
options and warrants and convertible securities and after the allocation of
earnings to the participating securities.
Use of Estimates
Management must make estimates and assumptions that affect the
Consolidated Financial Statements and the related footnote disclosures. Such
estimates are used in connection with certain fair value measurements. See
Note 25 to the Consolidated Financial Statements for further discussions
on estimates used in the determination of fair value. Moreover, estimates
are significant in determining the amounts of other-than-temporary
impairments, impairments of goodwill and other intangible assets, provisions
for probable losses that may arise from credit-related exposures and probable
and estimable losses related to litigation and regulatory proceedings, and tax
reserves. While management makes its best judgment, actual amounts or
results could differ from those estimates. Current market conditions increase
the risk and complexity of the judgments in these estimates.
Cash Flows
Cash equivalents are defined as those amounts included in Cash and due
from banks. Cash flows from risk management activities are classified in the
same category as the related assets and liabilities.
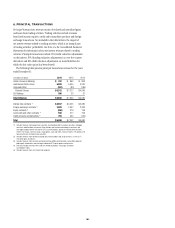
Related Party Transactions
The Company has related party transactions with certain of its subsidiaries
and affiliates. These transactions, which are primarily short-term in nature,
include cash accounts, collateralized financing transactions, margin
accounts, derivative trading, charges for operational support and the
borrowing and lending of funds, and are entered into in the ordinary course
of business.