Citibank 2014 Annual Report Download - page 23
Download and view the complete annual report
Please find page 23 of the 2014 Citibank annual report below. You can navigate through the pages in the report by either clicking on the pages listed below, or by using the keyword search tool below to find specific information within the annual report.-
 1
1 -
2
-
3
-
4
-
5
-
6
-
7
-
8
-
9
-
10
-
11
-
12
-
 13
13 -
 14
14 -
 15
15 -
 16
16 -
 17
17 -
 18
18 -
 19
19 -
 20
20 -
 21
21 -
 22
22 -
 23
23 -
 24
24 -
 25
25 -
 26
26 -
 27
27 -
 28
28 -
 29
29 -
 30
30 -
 31
31 -
 32
32 -
 33
33 -
34
-
35
-
36
-
37
-
38
-
39
-
40
-
41
-
42
-
43
-
44
-
45
-
46
-
47
-
48
-
49
-
50
-
51
-
52
-
53
-
54
-
55
-
56
-
57
-
58
-
59
-
60
-
61
-
62
-
63
-
64
-
65
-
66
-
67
-
68
-
69
-
70
-
71
-
72
-
73
-
74
-
75
-
76
-
77
-
78
-
79
-
80
-
81
-
82
-
83
-
84
-
85
-
86
-
87
-
88
-
89
-
90
-
91
-
92
-
93
-
94
-
95
-
96
-
97
-
98
-
99
-
100
-
101
-
102
-
103
-
104
-
105
-
106
-
107
-
108
-
109
-
110
-
111
-
112
-
113
-
114
-
115
-
116
-
117
-
118
-
119
-
120
-
121
-
122
-
123
-
124
-
125
-
126
-
127
-
128
-
129
-
130
-
131
-
132
-
133
-
134
-
135
-
136
-
137
-
138
-
139
-
140
-
141
-
142
-
143
-
144
-
145
-
146
-
147
-
148
-
149
-
150
-
151
-
152
-
153
-
154
-
155
-
156
-
157
-
158
-
159
-
160
-
161
-
162
-
163
-
164
-
165
-
166
-
167
-
168
-
169
-
170
-
171
-
172
-
173
-
174
-
175
-
176
-
177
-
178
-
179
-
180
-
181
-
182
-
183
-
184
-
185
-
186
-
187
-
188
-
189
-
190
-
191
-
192
-
193
-
194
-
195
-
196
-
197
-
198
-
199
-
200
-
201
-
202
-
203
-
204
-
205
-
206
-
207
-
208
-
209
-
210
-
211
-
212
-
213
-
214
-
215
-
216
-
217
-
218
-
219
-
220
-
221
-
222
-
223
-
224
-
225
-
226
-
227
-
228
-
229
-
230
-
231
-
232
-
233
-
234
-
235
-
236
-
237
-
238
-
239
-
240
-
241
-
242
-
243
-
244
-
245
-
246
-
247
-
248
-
249
-
250
-
251
-
252
-
253
-
254
-
255
-
256
-
257
-
258
-
259
-
260
-
261
-
262
-
263
-
264
-
265
-
266
-
267
-
268
-
269
-
270
-
271
-
272
-
273
-
274
-
275
-
276
-
277
-
278
-
279
-
280
-
281
-
282
-
283
-
284
-
285
-
286
-
287
-
288
-
289
-
290
-
291
-
292
-
293
-
294
-
295
-
296
-
297
-
298
-
299
-
300
-
301
-
302
-
303
-
304
-
305
-
306
-
307
-
308
-
309
-
310
-
311
-
312
-
313
-
314
-
315
-
316
-
317
-
318
-
319
-
320
-
321
-
322
-
323
-
324
-
325
-
326
-
327
 |
 |
6
MANAGEMENT’S DISCUSSION AND ANALYSIS OF FINANCIAL CONDITION AND
RESULTS OF OPERATIONS
EXECUTIVE SUMMARY
Steady Progress on Execution Priorities Despite Continued
Challenging Operating Environment
As discussed further throughout this Form 10-K, Citi’s 2014 results reflected
a continued challenging operating environment for Citi and its businesses in
several respects, including:
• the impact of macroeconomic uncertainty on the markets, trading
environment and customer activity, particularly during the latter part of
the year;
• significant costs associated with legal settlements as Citi resolved
its significant legacy legal issues and continued to work through its
outstanding legal matters;
• uneven global economic growth; and
• a continued low interest rate environment.
In addition, as part of its execution priorities to improve its efficiency and
reduce expenses, Citi incurred higher repositioning costs during the year,
which also impacted its 2014 results of operations.
Despite these difficult decisions and challenges, Citi continued to make
progress on its execution priorities in 2014, including:
• Efficient resource allocation and disciplined expense management: As
noted above, Citi continued to take actions to simplify and streamline the
organization as well as improve productivity. As part of these efforts, Citi
announced strategic actions to exit its consumer businesses in certain
international markets in Global Consumer Banking (GCB) and certain
businesses in Institutional Clients Group (ICG) to focus on those markets
and businesses where it believes it has the greatest scale, growth potential
and ability to provide meaningful returns to its shareholders.
• Wind down of Citi Holdings: Citi continued to wind down Citi Holdings,
including reducing its assets by $19 billion, or 16%, from year end 2013.
• Utilization of deferred tax assets (DTAs): Citi utilized approximately
$3.3 billion in DTAs during 2014 (for additional information, see
“Income Taxes” below).
While making progress on these initiatives in 2014, Citi expects the
operating environment in 2015 to remain challenging. Regulatory changes
and requirements continue to create uncertainties for Citi and its businesses.
While the U.S. economy continues to improve, it remains susceptible to
global events and volatility. The economic and fiscal situations of several
European countries remain fragile, and geopolitical tensions in the region
have added to the uncertainties. Although most emerging market economies
continue to grow, growth has slowed in some markets and these economies
are also susceptible to outside macroeconomic events and challenges. The
frequency with which legal and regulatory proceedings are initiated against
financial institutions, and the severity of the remedies sought in these
proceedings, has increased substantially over the past several years, including
2014. Financial institutions also remain a target for an increasing number
of cybersecurity attacks. For a more detailed discussion of these and other
risks that could impact Citi’s businesses, results of operations and financial
condition during 2015, see each respective business’ results of operations,
“Risk Factors” and “Managing Global Risk” below.
While Citi may not be able to completely control these and other factors
affecting its operating environment in 2015, it will remain focused on its
execution priorities, as described above, and remains committed to achieving
its 2015 financial targets for Citicorp’s operating efficiency ratio and
Citigroup’s return on assets.
2014 Summary Results
Citigroup
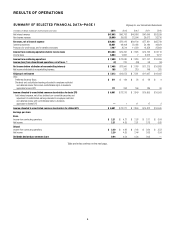
Citigroup reported net income of $7.3 billion or $2.20 per diluted share,
compared to $13.7 billion or $4.35 per share in 2013. In 2014, Citi’s
results included negative $390 million (negative $240 million after-tax)
of CVA/DVA, compared to negative $342 million (negative $213 million
after-tax) in 2013 (for additional information, including Citi’s adoption
of funding valuation adjustments, or FVA, in 2014, see Note 25 to the
Consolidated Financial Statements). Citi’s results in 2014 also included
a charge of $3.8 billion ($3.7 billion after-tax) related to the mortgage
settlement announced in July 2014 regarding certain of Citi’s legacy
residential mortgage-backed securities and CDO activities, recorded in Citi
Holdings. Results in 2014 further included a tax charge of approximately
$210 million related to corporate tax reforms enacted in two states, compared
to a tax benefit of $176 million in 2013 related to the resolution of certain
tax audit items, both recorded in Corporate/Other. In addition, Citi’s 2013
results included a net fraud loss in Mexico of $360 million ($235 million
after-tax) recorded in ICG, and a $189 million after-tax benefit related to the
divestiture of Credicard, Citi’s non-Citibank branded cards and consumer
finance business in Brazil (Credicard), recorded in Corporate/Other.
Excluding these items, Citi reported net income of $11.5 billion in 2014,
or $3.55 per diluted share, compared to $13.8 billion, or $4.37 per share, in
the prior year. The 16% decrease from 2013 was driven by higher expenses,
a lower net loan loss reserve release and a higher effective tax rate due
primarily to non-deductible legal and related expenses incurred during the
year (for additional information, see Note 9 to the Consolidated Financial
Statements), partially offset by increased revenues in Citi Holdings and a
decline in net credit losses. (Citi’s results of operations excluding the impacts
of CVA/DVA, the mortgage settlement, the tax items, the net fraud loss and
the Credicard divestiture are non-GAAP financial measures. Citi believes the
presentation of its results of operations excluding these impacts provides a
more meaningful depiction for investors of the underlying fundamentals of
its businesses.)
Citi’s revenues, net of interest expense, were $76.9 billion in 2014, up 1%
versus the prior year. Excluding CVA/DVA, revenues were $77.3 billion, also up
1% from 2013, as revenues rose 28% in Citi Holdings, partially offset by a 1%
decline in Citicorp. Net interest revenues of $48.0 billion were 3% higher than
2013, mostly driven by lower funding costs. Excluding CVA/DVA, non-interest
revenues were $29.3 billion, down 2% from 2013, driven by lower revenues in
ICG and GCB in Citicorp, partially offset by higher non-interest revenues in
Citi Holdings.