Citibank 2014 Annual Report Download - page 282
Download and view the complete annual report
Please find page 282 of the 2014 Citibank annual report below. You can navigate through the pages in the report by either clicking on the pages listed below, or by using the keyword search tool below to find specific information within the annual report.-
 1
1 -
2
-
3
-
4
-
5
-
6
-
7
-
8
-
9
-
10
-
11
-
12
-
13
-
14
-
15
-
16
-
17
-
18
-
19
-
20
-
21
-
22
-
23
-
24
-
25
-
26
-
27
-
28
-
29
-
30
-
31
-
32
-
33
-
34
-
35
-
36
-
37
-
38
-
39
-
40
-
41
-
42
-
43
-
44
-
45
-
46
-
47
-
48
-
49
-
50
-
51
-
52
-
53
-
54
-
55
-
56
-
57
-
58
-
59
-
60
-
61
-
62
-
63
-
64
-
65
-
66
-
67
-
68
-
69
-
70
-
71
-
72
-
73
-
74
-
75
-
76
-
77
-
78
-
79
-
80
-
81
-
82
-
83
-
84
-
85
-
86
-
87
-
88
-
89
-
90
-
91
-
92
-
93
-
94
-
95
-
96
-
97
-
98
-
99
-
100
-
101
-
102
-
103
-
104
-
105
-
106
-
107
-
108
-
109
-
110
-
111
-
112
-
113
-
114
-
115
-
116
-
117
-
118
-
119
-
120
-
121
-
122
-
123
-
124
-
125
-
126
-
127
-
128
-
129
-
130
-
131
-
132
-
133
-
134
-
135
-
136
-
137
-
138
-
139
-
140
-
141
-
142
-
143
-
144
-
145
-
146
-
147
-
148
-
149
-
150
-
151
-
152
-
153
-
154
-
155
-
156
-
157
-
158
-
159
-
160
-
161
-
162
-
163
-
164
-
165
-
166
-
167
-
168
-
169
-
170
-
171
-
172
-
173
-
174
-
175
-
176
-
177
-
178
-
179
-
180
-
181
-
182
-
183
-
184
-
185
-
186
-
187
-
188
-
189
-
190
-
191
-
192
-
193
-
194
-
195
-
196
-
197
-
198
-
199
-
200
-
201
-
202
-
203
-
204
-
205
-
206
-
207
-
208
-
209
-
210
-
211
-
212
-
213
-
214
-
215
-
216
-
217
-
218
-
219
-
220
-
221
-
222
-
223
-
224
-
225
-
226
-
227
-
228
-
229
-
230
-
231
-
232
-
233
-
234
-
235
-
236
-
237
-
238
-
239
-
240
-
241
-
242
-
243
-
244
-
245
-
246
-
247
-
248
-
249
-
250
-
251
-
252
-
253
-
254
-
255
-
256
-
257
-
258
-
259
-
260
-
261
-
262
-
263
-
264
-
265
-
266
-
267
-
268
-
269
-
270
-
271
-
 272
272 -
 273
273 -
 274
274 -
 275
275 -
 276
276 -
 277
277 -
 278
278 -
 279
279 -
 280
280 -
 281
281 -
 282
282 -
 283
283 -
 284
284 -
 285
285 -
 286
286 -
 287
287 -
 288
288 -
 289
289 -
 290
290 -
 291
291 -
 292
292 -
293
-
294
-
295
-
296
-
297
-
298
-
299
-
300
-
301
-
302
-
303
-
304
-
305
-
306
-
307
-
308
-
309
-
310
-
311
-
312
-
313
-
314
-
315
-
316
-
317
-
318
-
319
-
320
-
321
-
322
-
323
-
324
-
325
-
326
-
327
 |
 |

265
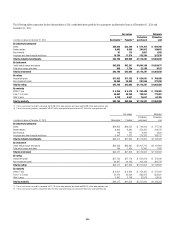
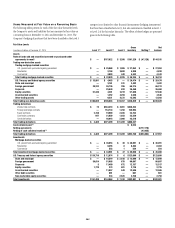
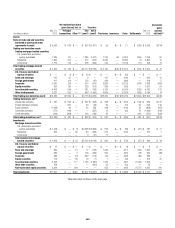
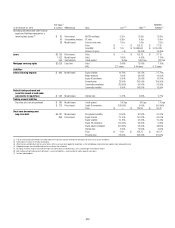
In millions of dollars at December 31, 2013 Level 1 (1) Level 2 (1) Level 3
Gross
inventory Netting (2)
Net
balance
Loans (4) $ — $ 886 $ 4,143 $ 5,029 $ — $ 5,029
Mortgage servicing rights — — 2,718 2,718 — 2,718
Non-trading derivatives and other financial assets measured
on a recurring basis, gross $ — $ 9,811 $ 181 $ 9,992
Cash collateral paid 82
Netting of cash collateral received (7) $ (2,951)
Non-trading derivatives and other financial assets measured
on a recurring basis $ — $ 9,811 $ 181 $ 10,074 $ (2,951) $ 7,123
Total assets $233,316 $1,234,714 $ 45,685 $1,519,870 $ (783,773) $736,097
Total as a percentage of gross assets (5) 15.4% 81.6% 3.0%
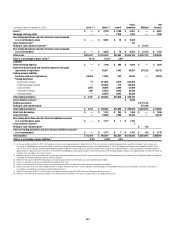
Liabilities
Interest-bearing deposits $ — $ 787 $ 890 $ 1,677 $ — $ 1,677
Federal funds purchased and securities loaned or sold under
agreements to repurchase — 85,576 902 86,478 (32,331) 54,147
Trading account liabilities
Securities sold, not yet purchased 51,035 9,883 590 61,508 61,508
Trading account derivatives
Interest rate contracts 12 614,586 2,628 617,226
Foreign exchange contracts 29 87,978 630 88,637
Equity contracts 5,783 26,178 2,331 34,292
Commodity contracts 363 7,613 2,194 10,170
Credit derivatives — 37,510 3,284 40,794
Total trading derivatives $ 6,187 $ 773,865 $ 11,067 $ 791,119
Cash collateral received (6) $ 8,827
Netting agreements $ (713,598)
Netting of cash collateral paid (3) (39,094)
Total trading derivatives $ 6,187 $ 773,865 $ 11,067 $ 799,946 $ (752,692) $ 47,254
Short-term borrowings $ — $ 3,663 $ 29 $ 3,692 $ — $ 3,692
Long-term debt — 19,256 7,621 26,877 — 26,877
Non-trading derivatives and other financial liabilities measured
on a recurring basis, gross $ — $ 1,719 $ 10 $ 1,729
Cash collateral received (7) $ 282
Non-trading derivatives and other financial liabilities measured
on a recurring basis — 1,719 10 2,011 2,011
Total liabilities $ 57,222 $ 894,749 $ 21,109 $ 982,189 $ (785,023) $197,166
Total as a percentage of gross liabilities (5) 5.9% 92.0% 2.2%
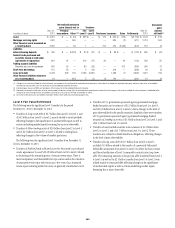
(1) For the year ended December 31, 2013, the Company transferred assets of approximately $2.5 billion from Level 1 to Level 2, primarily related to foreign government securities, which were not traded with sufficient
frequency to constitute an active market. During the year ended December 31, 2013, the Company transferred assets of approximately $49.3 billion from Level 2 to Level 1, substantially all related to U.S. Treasury
securities held across the Company’s major investment portfolios where Citi obtained additional information from its external pricing sources to meet the criteria for Level 1 classification. There were no material liability
transfers between Level 1 and Level 2 during the year ended December 31, 2013.
(2) Represents netting of: (i) the amounts due under securities purchased under agreements to resell and the amounts owed under securities sold under agreements to repurchase; and (ii) derivative exposures covered by
a qualifying master netting agreement and cash collateral offsetting.
(3) Reflects the net amount of $45,167 million of gross cash collateral paid, of which $39,094 million was used to offset derivative liabilities.
(4) There is no allowance for loan losses recorded for loans reported at fair value.
(5) Because the amount of the cash collateral paid/received has not been allocated to the Level 1, 2 and 3 subtotals, these percentages are calculated based on total assets and liabilities measured at fair value on a
recurring basis, excluding the cash collateral paid/received on derivatives.
(6) Reflects the net amount of $43,720 million of gross cash collateral received, of which $34,893 million was used to offset derivative assets.
(7) Reflects the net amount of $3,233 million of gross cash collateral received, of which $2,951 million was used to offset derivative assets.