Citibank 2014 Annual Report Download - page 229
Download and view the complete annual report
Please find page 229 of the 2014 Citibank annual report below. You can navigate through the pages in the report by either clicking on the pages listed below, or by using the keyword search tool below to find specific information within the annual report.-
 1
1 -
2
-
3
-
4
-
5
-
6
-
7
-
8
-
9
-
10
-
11
-
12
-
13
-
14
-
15
-
16
-
17
-
18
-
19
-
20
-
21
-
22
-
23
-
24
-
25
-
26
-
27
-
28
-
29
-
30
-
31
-
32
-
33
-
34
-
35
-
36
-
37
-
38
-
39
-
40
-
41
-
42
-
43
-
44
-
45
-
46
-
47
-
48
-
49
-
50
-
51
-
52
-
53
-
54
-
55
-
56
-
57
-
58
-
59
-
60
-
61
-
62
-
63
-
64
-
65
-
66
-
67
-
68
-
69
-
70
-
71
-
72
-
73
-
74
-
75
-
76
-
77
-
78
-
79
-
80
-
81
-
82
-
83
-
84
-
85
-
86
-
87
-
88
-
89
-
90
-
91
-
92
-
93
-
94
-
95
-
96
-
97
-
98
-
99
-
100
-
101
-
102
-
103
-
104
-
105
-
106
-
107
-
108
-
109
-
110
-
111
-
112
-
113
-
114
-
115
-
116
-
117
-
118
-
119
-
120
-
121
-
122
-
123
-
124
-
125
-
126
-
127
-
128
-
129
-
130
-
131
-
132
-
133
-
134
-
135
-
136
-
137
-
138
-
139
-
140
-
141
-
142
-
143
-
144
-
145
-
146
-
147
-
148
-
149
-
150
-
151
-
152
-
153
-
154
-
155
-
156
-
157
-
158
-
159
-
160
-
161
-
162
-
163
-
164
-
165
-
166
-
167
-
168
-
169
-
170
-
171
-
172
-
173
-
174
-
175
-
176
-
177
-
178
-
179
-
180
-
181
-
182
-
183
-
184
-
185
-
186
-
187
-
188
-
189
-
190
-
191
-
192
-
193
-
194
-
195
-
196
-
197
-
198
-
199
-
200
-
201
-
202
-
203
-
204
-
205
-
206
-
207
-
208
-
209
-
210
-
211
-
212
-
213
-
214
-
215
-
216
-
217
-
218
-
 219
219 -
 220
220 -
 221
221 -
 222
222 -
 223
223 -
 224
224 -
 225
225 -
 226
226 -
 227
227 -
 228
228 -
 229
229 -
 230
230 -
 231
231 -
 232
232 -
 233
233 -
 234
234 -
 235
235 -
 236
236 -
 237
237 -
 238
238 -
 239
239 -
240
-
241
-
242
-
243
-
244
-
245
-
246
-
247
-
248
-
249
-
250
-
251
-
252
-
253
-
254
-
255
-
256
-
257
-
258
-
259
-
260
-
261
-
262
-
263
-
264
-
265
-
266
-
267
-
268
-
269
-
270
-
271
-
272
-
273
-
274
-
275
-
276
-
277
-
278
-
279
-
280
-
281
-
282
-
283
-
284
-
285
-
286
-
287
-
288
-
289
-
290
-
291
-
292
-
293
-
294
-
295
-
296
-
297
-
298
-
299
-
300
-
301
-
302
-
303
-
304
-
305
-
306
-
307
-
308
-
309
-
310
-
311
-
312
-
313
-
314
-
315
-
316
-
317
-
318
-
319
-
320
-
321
-
322
-
323
-
324
-
325
-
326
-
327
 |
 |

212
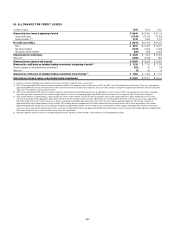
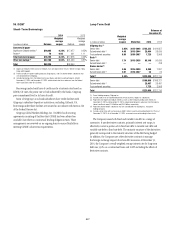
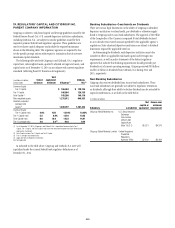
16. ALLOWANCE FOR CREDIT LOSSES
In millions of dollars 2014 2013 2012
Allowance for loan losses at beginning of period $ 19,648 $25,455 $ 30,115
Gross credit losses (11,108) (12,769) (17,005)
Gross recoveries (1)(2)(3) 2,135 2,306 2,774
Net credit losses (NCLs) $ (8,973) $(10,463) $(14,231)
NCLs $ 8,973 $ 10,463 $ 14,231
Net reserve releases (1,879) (1,961) (1,908)
Net specific reserve releases (266) (898) (1,865)
Total provision for credit losses $ 6,828 $ 7,604 $ 10,458
Other, net (4) (1,509) (2,948) (887)
Allowance for loan losses at end of period $ 15,994 $ 19,648 $ 25,455
Allowance for credit losses on unfunded lending commitments at beginning of period (5) $ 1,229 $ 1,119 $ 1,136
Provision (release) for unfunded lending commitments (162) 80 (16)
Other, net (4) 30 (1)
Allowance for credit losses on unfunded lending commitments at end of period (5) $ 1,063 $ 1,229 $ 1,119
Total allowance for loans, leases, and unfunded lending commitments $ 17,057 $ 20,877 $ 26,574
(1) Recoveries have been reduced by certain collection costs that are incurred only if collection efforts are successful.
(2) 2012 includes approximately $635 million of incremental charge-offs related to OCC guidance issued in the third quarter of 2012 (see Note 1 to the Consolidated Financial Statements). There was a corresponding
approximately $600 million release in the third quarter of 2012 allowance for loan losses related to these charge-offs. 2012 also includes a benefit to charge-offs of approximately $40 million related to finalizing the
impact of this OCC guidance in the fourth quarter of 2012.
(3) 2012 includes approximately $370 million of incremental charge-offs related to previously deferred principal balances on modified loans in the first quarter of 2012. These charge-offs were related to anticipated
forgiveness of principal in connection with the national mortgage settlement. There was a corresponding approximately $350 million reserve release in the first quarter of 2012 related to these charge-offs.
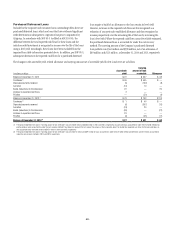
(4) 2014 includes reductions of approximately $1.1 billion related to the sale or transfer to held-for-sale (HFS) of various loan portfolios, which includes approximately $411 million related to the transfer of various
real estate loan portfolios to HFS, approximately $204 million related to the transfer to HFS of a business in Greece, approximately $177 million related to the transfer to HFS of a business in Spain, approximately
$29 million related to the transfer to HFS of a business in Honduras, and approximately $108 million related to the transfer to HFS of various EMEA loan portfolios. Additionally, 2014 includes a reduction of
approximately $463 million related to foreign currency translation. 2013 includes reductions of approximately $2.4 billion related to the sale or transfer to held-for-sale of various loan portfolios, which includes
approximately $360 million related to the sale of Credicard and approximately $255 million related to a transfer to held-for-sale of a loan portfolio in Greece, approximately $230 million related to a non-provision
transfer of reserves associated with deferred interest to other assets which includes deferred interest and approximately $220 million related to foreign currency translation. 2012 includes reductions of approximately
$875 million related to the sale or transfer to held-for-sale of various U.S. loan portfolios.
(5) Represents additional credit loss reserves for unfunded lending commitments and letters of credit recorded in Other liabilities on the Consolidated Balance Sheet.