Citibank 2014 Annual Report Download - page 24
Download and view the complete annual report
Please find page 24 of the 2014 Citibank annual report below. You can navigate through the pages in the report by either clicking on the pages listed below, or by using the keyword search tool below to find specific information within the annual report.-
 1
1 -
2
-
3
-
4
-
5
-
6
-
7
-
8
-
9
-
10
-
11
-
12
-
13
-
 14
14 -
 15
15 -
 16
16 -
 17
17 -
 18
18 -
 19
19 -
 20
20 -
 21
21 -
 22
22 -
 23
23 -
 24
24 -
 25
25 -
 26
26 -
 27
27 -
 28
28 -
 29
29 -
 30
30 -
 31
31 -
 32
32 -
 33
33 -
 34
34 -
35
-
36
-
37
-
38
-
39
-
40
-
41
-
42
-
43
-
44
-
45
-
46
-
47
-
48
-
49
-
50
-
51
-
52
-
53
-
54
-
55
-
56
-
57
-
58
-
59
-
60
-
61
-
62
-
63
-
64
-
65
-
66
-
67
-
68
-
69
-
70
-
71
-
72
-
73
-
74
-
75
-
76
-
77
-
78
-
79
-
80
-
81
-
82
-
83
-
84
-
85
-
86
-
87
-
88
-
89
-
90
-
91
-
92
-
93
-
94
-
95
-
96
-
97
-
98
-
99
-
100
-
101
-
102
-
103
-
104
-
105
-
106
-
107
-
108
-
109
-
110
-
111
-
112
-
113
-
114
-
115
-
116
-
117
-
118
-
119
-
120
-
121
-
122
-
123
-
124
-
125
-
126
-
127
-
128
-
129
-
130
-
131
-
132
-
133
-
134
-
135
-
136
-
137
-
138
-
139
-
140
-
141
-
142
-
143
-
144
-
145
-
146
-
147
-
148
-
149
-
150
-
151
-
152
-
153
-
154
-
155
-
156
-
157
-
158
-
159
-
160
-
161
-
162
-
163
-
164
-
165
-
166
-
167
-
168
-
169
-
170
-
171
-
172
-
173
-
174
-
175
-
176
-
177
-
178
-
179
-
180
-
181
-
182
-
183
-
184
-
185
-
186
-
187
-
188
-
189
-
190
-
191
-
192
-
193
-
194
-
195
-
196
-
197
-
198
-
199
-
200
-
201
-
202
-
203
-
204
-
205
-
206
-
207
-
208
-
209
-
210
-
211
-
212
-
213
-
214
-
215
-
216
-
217
-
218
-
219
-
220
-
221
-
222
-
223
-
224
-
225
-
226
-
227
-
228
-
229
-
230
-
231
-
232
-
233
-
234
-
235
-
236
-
237
-
238
-
239
-
240
-
241
-
242
-
243
-
244
-
245
-
246
-
247
-
248
-
249
-
250
-
251
-
252
-
253
-
254
-
255
-
256
-
257
-
258
-
259
-
260
-
261
-
262
-
263
-
264
-
265
-
266
-
267
-
268
-
269
-
270
-
271
-
272
-
273
-
274
-
275
-
276
-
277
-
278
-
279
-
280
-
281
-
282
-
283
-
284
-
285
-
286
-
287
-
288
-
289
-
290
-
291
-
292
-
293
-
294
-
295
-
296
-
297
-
298
-
299
-
300
-
301
-
302
-
303
-
304
-
305
-
306
-
307
-
308
-
309
-
310
-
311
-
312
-
313
-
314
-
315
-
316
-
317
-
318
-
319
-
320
-
321
-
322
-
323
-
324
-
325
-
326
-
327
 |
 |
7
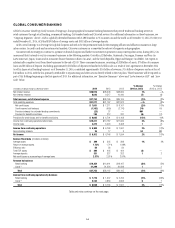
Expenses
Citigroup expenses increased 14% versus 2013 to $55.1 billion. Excluding
the impact of the mortgage settlement in 2014 and the net fraud loss in
2013, operating expenses increased 7% versus the prior year to $51.3 billion
driven by higher legal and related expenses ($5.8 billion compared to
$3.0 billion in the prior year) and repositioning costs ($1.6 billion compared
to $590 million in the prior year).
Excluding the legal and related expenses, net fraud loss in 2013,
repositioning charges and the impact of foreign exchange translation into
U.S. dollars for reporting purposes (FX translation), which lowered reported
expenses by approximately $503 million in 2014 compared to 2013, expenses
were roughly unchanged at $43.9 billion as repositioning savings, expense
reductions in Citi Holdings and other productivity initiatives were fully offset
by the impact of higher regulatory and compliance and volume-related
costs. (Citi’s results of operations excluding the impact of legal and related
expenses, repositioning charges and FX translation are non-GAAP financial
measures. Citi believes the presentation of its results of operations excluding
these impacts provides a more meaningful depiction for investors of the
underlying fundamentals of its businesses.)
Excluding the impact of the net fraud loss in 2013, Citicorp’s expenses
were $47.3 billion, up 12% from the prior year, primarily reflecting higher
legal and related expenses, largely in Corporate/Other ($4.8 billion
compared to $432 million in 2013), higher repositioning costs ($1.6 billion
compared to $547 million in 2013), higher regulatory and compliance
costs and higher volume-related costs, partially offset by efficiency savings.
Excluding the impact of the mortgage settlement in 2014, Citi Holdings’
expenses were $4.0 billion, down 34% from 2013, reflecting lower legal and
related expenses as well as the ongoing decline in Citi Holdings’ assets.
Credit Costs and Allowance for Loan Losses
Citi’s total provisions for credit losses and for benefits and claims of
$7.5 billion declined 12% from 2013. Excluding the impact of the mortgage
settlement in 2014, total provisions for credit losses and for benefits and
claims declined 13% to $7.4 billion versus the prior year. Net credit losses
of $9.0 billion were down 14% versus the prior year. Consumer net credit
losses declined 15% to $8.7 billion, reflecting continued improvements in
the North America mortgage portfolio within Citi Holdings, as well as North
America Citi-branded cards and Citi retail services in Citicorp. Corporate
net credit losses increased 43% to $288 million in 2014. Corporate net credit
losses in 2014 included approximately $113 million of incremental net
credit losses related to the Pemex supplier program in Mexico (for additional
information regarding the Pemex supplier program, see “Institutional
Clients Group” below).
The net release of allowance for loan losses and unfunded lending
commitments was $2.3 billion in 2014. Excluding the impact of the
mortgage settlement in 2014, the net release of allowance for loan losses
and unfunded lending commitments was $2.4 billion in 2014 compared
to a $2.8 billion release in the prior year. Citicorp’s net reserve release
increased to $1.4 billion from $736 million in 2013 due to higher reserve
releases in North America GCB and ICG, reflecting improved credit trends.
Citi Holdings’ net reserve release, excluding the impact of the mortgage
settlement in 2014, decreased 53% to $958 million, primarily due to lower
releases related to the North America mortgage portfolio (which also had
lower net credit losses).
Citigroup’s total allowance for loan losses was $16.0 billion at year end, or
2.50% of total loans, compared to $19.6 billion, or 2.97%, at the end of 2013.
The decline in the total allowance for loan losses reflected the continued
wind down of Citi Holdings and overall continued improvement in the credit
quality of Citi’s loan portfolios. The consumer allowance for loan losses
was $13.6 billion, or 3.68% of total consumer loans, at year end, compared
to $17.1 billion, or 4.34% of total loans, at the end of 2013. The consumer
90+ days past due delinquencies were $4.6 billion, or 1.27% of consumer
loans, at year end, a decline from $5.7 billion or 1.49% of loans in the prior
year. Total non-accrual assets fell to $7.4 billion, a 22% reduction compared
to 2013. Corporate non-accrual loans declined 38% to $1.2 billion, while
Consumer non-accrual loans declined 17% to $5.9 billion, both reflecting the
continued improvement in credit trends.
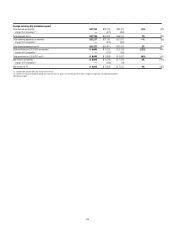
Capital
Despite the challenging operating environment and elevated legal and
related expenses during 2014, Citi was able to maintain its regulatory
capital, primarily through net income and the further reduction of its DTAs.
Citigroup’s Basel III Tier 1 Capital and Common Equity Tier 1 Capital ratios,
on a fully implemented basis, were 11.5% and 10.6% as of December 31,
2014, respectively, compared to 11.3% and 10.6% as of December 31, 2013
(all based on the Advanced Approaches for determining risk-weighted
assets). Citigroup’s estimated Basel III Supplementary Leverage ratio as
of December 31, 2014 was 6.0% compared to 5.4% as of December 31,
2013, each based on the revised final U.S. Basel III rules. For additional
information on Citi’s capital ratios and related components, see “Capital
Resources” below.
Citicorp
Citicorp net income decreased 32% from the prior year to $10.7 billion.
CVA/DVA, recorded in ICG, was negative $343 million (negative $211 million
after-tax) in 2014, compared to negative $345 million (negative
$214 million after-tax) in the prior year (for a summary of CVA/DVA by
business within ICG, see “Institutional Clients Group” below).
Excluding CVA/DVA as well as the impact of the net fraud loss in Mexico,
the tax items and the divestiture of Credicard noted above, Citicorp’s net
income was $11.1 billion, down 29% from the prior year, as higher expenses,
a higher effective tax rate and lower revenues were partially offset by
continued improvement in credit costs.
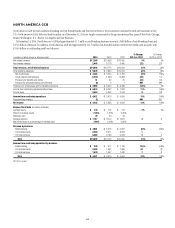
Citicorp revenues, net of interest expense, decreased 1% from the prior
year to $71.1 billion. Excluding CVA/DVA, Citicorp revenues were $71.4 billion
in 2014, also down 1% from the prior year. GCB revenues of $37.8 billion
decreased 1% versus the prior year. North America GCB revenues declined
1% to $19.6 billion driven by lower retail banking revenues, partially offset
by higher revenues in Citi-branded cards and Citi retail services. Retail
banking revenues declined 9% to $4.9 billion versus the prior year, primarily
reflecting lower mortgage origination revenues and spread compression in