Citibank 2014 Annual Report Download - page 39
Download and view the complete annual report
Please find page 39 of the 2014 Citibank annual report below. You can navigate through the pages in the report by either clicking on the pages listed below, or by using the keyword search tool below to find specific information within the annual report.-
 1
1 -
2
-
3
-
4
-
5
-
6
-
7
-
8
-
9
-
10
-
11
-
12
-
13
-
14
-
15
-
16
-
17
-
18
-
19
-
20
-
21
-
22
-
23
-
24
-
25
-
26
-
27
-
28
-
 29
29 -
 30
30 -
 31
31 -
 32
32 -
 33
33 -
 34
34 -
 35
35 -
 36
36 -
 37
37 -
 38
38 -
 39
39 -
 40
40 -
 41
41 -
 42
42 -
 43
43 -
 44
44 -
 45
45 -
 46
46 -
 47
47 -
 48
48 -
 49
49 -
50
-
51
-
52
-
53
-
54
-
55
-
56
-
57
-
58
-
59
-
60
-
61
-
62
-
63
-
64
-
65
-
66
-
67
-
68
-
69
-
70
-
71
-
72
-
73
-
74
-
75
-
76
-
77
-
78
-
79
-
80
-
81
-
82
-
83
-
84
-
85
-
86
-
87
-
88
-
89
-
90
-
91
-
92
-
93
-
94
-
95
-
96
-
97
-
98
-
99
-
100
-
101
-
102
-
103
-
104
-
105
-
106
-
107
-
108
-
109
-
110
-
111
-
112
-
113
-
114
-
115
-
116
-
117
-
118
-
119
-
120
-
121
-
122
-
123
-
124
-
125
-
126
-
127
-
128
-
129
-
130
-
131
-
132
-
133
-
134
-
135
-
136
-
137
-
138
-
139
-
140
-
141
-
142
-
143
-
144
-
145
-
146
-
147
-
148
-
149
-
150
-
151
-
152
-
153
-
154
-
155
-
156
-
157
-
158
-
159
-
160
-
161
-
162
-
163
-
164
-
165
-
166
-
167
-
168
-
169
-
170
-
171
-
172
-
173
-
174
-
175
-
176
-
177
-
178
-
179
-
180
-
181
-
182
-
183
-
184
-
185
-
186
-
187
-
188
-
189
-
190
-
191
-
192
-
193
-
194
-
195
-
196
-
197
-
198
-
199
-
200
-
201
-
202
-
203
-
204
-
205
-
206
-
207
-
208
-
209
-
210
-
211
-
212
-
213
-
214
-
215
-
216
-
217
-
218
-
219
-
220
-
221
-
222
-
223
-
224
-
225
-
226
-
227
-
228
-
229
-
230
-
231
-
232
-
233
-
234
-
235
-
236
-
237
-
238
-
239
-
240
-
241
-
242
-
243
-
244
-
245
-
246
-
247
-
248
-
249
-
250
-
251
-
252
-
253
-
254
-
255
-
256
-
257
-
258
-
259
-
260
-
261
-
262
-
263
-
264
-
265
-
266
-
267
-
268
-
269
-
270
-
271
-
272
-
273
-
274
-
275
-
276
-
277
-
278
-
279
-
280
-
281
-
282
-
283
-
284
-
285
-
286
-
287
-
288
-
289
-
290
-
291
-
292
-
293
-
294
-
295
-
296
-
297
-
298
-
299
-
300
-
301
-
302
-
303
-
304
-
305
-
306
-
307
-
308
-
309
-
310
-
311
-
312
-
313
-
314
-
315
-
316
-
317
-
318
-
319
-
320
-
321
-
322
-
323
-
324
-
325
-
326
-
327
 |
 |

22
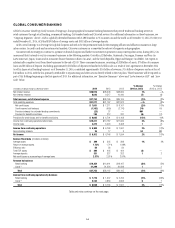
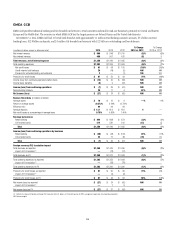
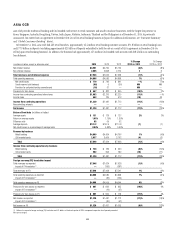
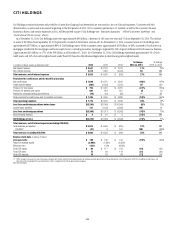
ASIA GCB
Asia GCB provides traditional banking and Citi-branded card services to retail customers and small to mid-size businesses, with the largest Citi presence in
Korea, Singapore, Australia, Hong Kong, Taiwan, India, Japan, Malaysia, Indonesia, Thailand and the Philippines as of December 31, 2014. As previously
announced, Citi entered into an agreement in December 2014 to sell its retail banking business in Japan (for additional information, see “Executive Summary”
and “Global Consumer Banking” above).
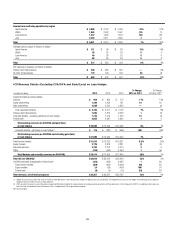
At December 31, 2014, Asia GCB had 465 retail branches, approximately 16.4 million retail banking customer accounts, $71.8 billion in retail banking loans
and $77.9 billion in deposits (excluding approximately $21 billion of deposits reclassified to held-for-sale as a result of Citi’s agreement in December 2014 to
sell its Japan retail banking business). In addition, the business had approximately 16.5 million Citi-branded card accounts with $18.4 billion in outstanding
loan balances.
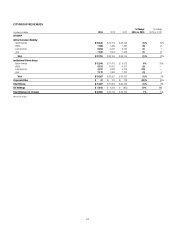
In millions of dollars, except as otherwise noted 2014 2013 2012
% Change
2014 vs. 2013
% Change
2013 vs. 2012
Net interest revenue $4,581 $4,756 $5,154 (4)% (8)%
Non-interest revenue 2,965 2,868 2,774 33
Total revenues, net of interest expense $7,546 $7,624 $7,928 (1)% (4)%
Total operating expenses $4,896 $4,586 $4,898 7% (6)%
Net credit losses $ 779 $ 782 $ 841 —% (7)%
Credit reserve build (release) (96) 9 (36) NM NM
Provision for unfunded lending commitments (16) 31 — NM —
Provisions for loan losses $ 667 $ 822 $ 805 (19)% 2%
Income from continuing operations before taxes $1,983 $2,216 $2,225 (11)% —%
Income taxes 663 735 513 (10) 43
Income from continuing operations $1,320 $1,481 $1,712 (11)% (13)%
Noncontrolling interests —— — ——
Net income $1,320 $1,481 $1,712 (11)% (13)%
Balance Sheet data (in billions of dollars)
Average assets $ 131 $ 129 $ 127 2% 2%
Return on average assets 1.01% 1.15% 1.35%
Efficiency ratio 65 60 62
Average deposits $101.2 $102.6 $110.8 (1) (7)
Net credit losses as a percentage of average loans 0.84% 0.88% 0.95%
Revenue by business
Retail banking $4,609 $4,564 $4,766 1% (4)%
Citi-branded cards 2,937 3,060 3,162 (4) (3)
Total $7,546 $7,624 $7,928 (1)% (4)%
Income from continuing operations by business
Retail banking $ 738 $ 786 $ 930 (6)% (15)%
Citi-branded cards 582 695 782 (16) (11)
Total $1,320 $1,481 $1,712 (11)% (13)%
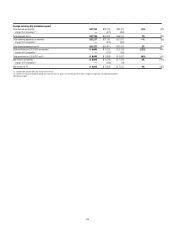
Foreign currency (FX) translation impact
Total revenues-as reported $7,546 $7,624 $7,928 (1)% (4)%
Impact of FX translation (1) —(156) (387)
Total revenues-ex-FX $7,546 $7,468 $7,541 1% (1)%
Total operating expenses-as reported $4,896 $4,586 $4,898 7% (6)%
Impact of FX translation (1) —(82) (254)
Total operating expenses-ex-FX $4,896 $4,504 $4,644 9% (3)%
Provisions for loan losses-as reported $ 667 $ 822 $ 805 (19)% 2%
Impact of FX translation (1) —(16) (27)
Provisions for loan losses-ex-FX $ 667 $ 806 $ 778 (17)% 4%
Net income-as reported $1,320 $1,481 $1,712 (11)% (13)%
Impact of FX translation (1) —(30) (57)
Net income-ex-FX $1,320 $1,451 $1,655 (9)% (12)%
(1) Reflects the impact of foreign exchange (FX) translation into U.S. dollars at the fourth quarter of 2014 average exchange rates for all periods presented.
NM Not meaningful