Citibank 2014 Annual Report Download - page 49
Download and view the complete annual report
Please find page 49 of the 2014 Citibank annual report below. You can navigate through the pages in the report by either clicking on the pages listed below, or by using the keyword search tool below to find specific information within the annual report.-
 1
1 -
2
-
3
-
4
-
5
-
6
-
7
-
8
-
9
-
10
-
11
-
12
-
13
-
14
-
15
-
16
-
17
-
18
-
19
-
20
-
21
-
22
-
23
-
24
-
25
-
26
-
27
-
28
-
29
-
30
-
31
-
32
-
33
-
34
-
35
-
36
-
37
-
38
-
 39
39 -
 40
40 -
 41
41 -
 42
42 -
 43
43 -
 44
44 -
 45
45 -
 46
46 -
 47
47 -
 48
48 -
 49
49 -
 50
50 -
 51
51 -
 52
52 -
 53
53 -
 54
54 -
 55
55 -
 56
56 -
 57
57 -
 58
58 -
 59
59 -
60
-
61
-
62
-
63
-
64
-
65
-
66
-
67
-
68
-
69
-
70
-
71
-
72
-
73
-
74
-
75
-
76
-
77
-
78
-
79
-
80
-
81
-
82
-
83
-
84
-
85
-
86
-
87
-
88
-
89
-
90
-
91
-
92
-
93
-
94
-
95
-
96
-
97
-
98
-
99
-
100
-
101
-
102
-
103
-
104
-
105
-
106
-
107
-
108
-
109
-
110
-
111
-
112
-
113
-
114
-
115
-
116
-
117
-
118
-
119
-
120
-
121
-
122
-
123
-
124
-
125
-
126
-
127
-
128
-
129
-
130
-
131
-
132
-
133
-
134
-
135
-
136
-
137
-
138
-
139
-
140
-
141
-
142
-
143
-
144
-
145
-
146
-
147
-
148
-
149
-
150
-
151
-
152
-
153
-
154
-
155
-
156
-
157
-
158
-
159
-
160
-
161
-
162
-
163
-
164
-
165
-
166
-
167
-
168
-
169
-
170
-
171
-
172
-
173
-
174
-
175
-
176
-
177
-
178
-
179
-
180
-
181
-
182
-
183
-
184
-
185
-
186
-
187
-
188
-
189
-
190
-
191
-
192
-
193
-
194
-
195
-
196
-
197
-
198
-
199
-
200
-
201
-
202
-
203
-
204
-
205
-
206
-
207
-
208
-
209
-
210
-
211
-
212
-
213
-
214
-
215
-
216
-
217
-
218
-
219
-
220
-
221
-
222
-
223
-
224
-
225
-
226
-
227
-
228
-
229
-
230
-
231
-
232
-
233
-
234
-
235
-
236
-
237
-
238
-
239
-
240
-
241
-
242
-
243
-
244
-
245
-
246
-
247
-
248
-
249
-
250
-
251
-
252
-
253
-
254
-
255
-
256
-
257
-
258
-
259
-
260
-
261
-
262
-
263
-
264
-
265
-
266
-
267
-
268
-
269
-
270
-
271
-
272
-
273
-
274
-
275
-
276
-
277
-
278
-
279
-
280
-
281
-
282
-
283
-
284
-
285
-
286
-
287
-
288
-
289
-
290
-
291
-
292
-
293
-
294
-
295
-
296
-
297
-
298
-
299
-
300
-
301
-
302
-
303
-
304
-
305
-
306
-
307
-
308
-
309
-
310
-
311
-
312
-
313
-
314
-
315
-
316
-
317
-
318
-
319
-
320
-
321
-
322
-
323
-
324
-
325
-
326
-
327
 |
 |
32
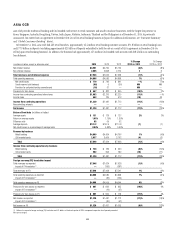
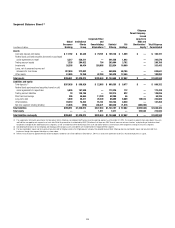
Loans
The impact of FX translation on Citi’s reported loans was a negative
$17 billion versus the prior-year period and negative $10 billion sequentially.
Excluding the impact of FX translation, Citi’s loans decreased 1%
from the prior-year period, as 3% loan growth in Citicorp was offset by
the continued declines in Citi Holdings. Consumer loans grew 2% year-
over-year, driven by 4% growth internationally. Corporate loans grew 4%
year-over-year. Traditional corporate lending balances grew 4%, with growth
in North America driven by higher client transaction activity. Treasury and
trade solutions loans decreased 8%, as Citi maintained trade origination
volumes while reducing lower spread assets and increasing asset sales to
optimize returns. Private bank and markets loans increased 16%, led by
growth in the North America private bank, contributing to the revenue
growth in that business. Citi Holdings loans decreased 21% year-over-year,
mainly due to continued runoff and asset sales in the North America
mortgage portfolio as well as the sales of the Greece and Spain consumer
operations in the third quarter of 2014.
Sequentially, loans were relatively unchanged, excluding the impact of
FX translation, as the decline in Citi Holdings loans was offset by continued
growth in Citicorp, driven by consumer loans.
During the fourth quarter of 2014, average loans of $651 billion yielded
an average rate of 6.7%, compared to $659 billion and 6.7% in the third
quarter of 2014 and $659 billion and 7.0% in the fourth quarter of 2013.
For further information on Citi’s loan portfolios, see “Managing Global
Risk—Credit Risk” and “— Country Risk” below.
Other Assets
The fluctuations in other assets during the periods presented were largely
changes in brokerage receivables driven by normal business activities.
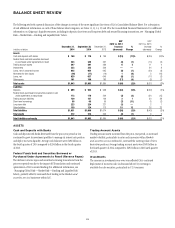
LIABILITIES
Deposits
For a discussion of Citi’s deposits, see “Managing Global Risk—Market
Risk—Funding and Liquidity Risk” below.
Federal Funds Purchased and Securities Loaned or Sold
Under Agreements to Repurchase (Repos)
Citi’s federal funds purchased were not significant for the periods presented.
The decrease in repos and securities lending transactions was due to the
impact of FX translation and the continued optimization of secured funding.
For further information on Citi’s secured financing transactions, see
“Managing Global Risk—Market Risk—Funding and Liquidity” below.
Trading Account Liabilities
The increase in trading account liabilities from the prior-year period was
consistent with and driven by the increase in trading account assets, as
discussed above. Average trading account liabilities were $147 billion during
the fourth quarter of 2014, compared to $112 billion in the fourth quarter
of 2013.
Debt
For information on Citi’s long-term and short-term debt borrowings,
see “Managing Global Risk—Market Risk—Funding and Liquidity
Risk” below.
Other Liabilities
The increase in other liabilities from the prior-year period was driven by the
reclassification to held-for-sale of approximately $21 billion of deposits as
a result of Citi’s entry into an agreement in December 2014 to sell its Japan
retail banking business, as well as changes in the levels of brokerage payables
driven by normal business activities.