Citibank 2014 Annual Report Download - page 299
Download and view the complete annual report
Please find page 299 of the 2014 Citibank annual report below. You can navigate through the pages in the report by either clicking on the pages listed below, or by using the keyword search tool below to find specific information within the annual report.-
 1
1 -
 2
2 -
 3
3 -
 4
4 -
 5
5 -
 6
6 -
 7
7 -
 8
8 -
 9
9 -
 10
10 -
 11
11 -
 12
12 -
 13
13 -
 14
14 -
 15
15 -
 16
16 -
 17
17 -
 18
18 -
 19
19 -
 20
20 -
 21
21 -
 22
22 -
 23
23 -
 24
24 -
 25
25 -
 26
26 -
 27
27 -
 28
28 -
 29
29 -
 30
30 -
 31
31 -
 32
32 -
 33
33 -
 34
34 -
 35
35 -
 36
36 -
 37
37 -
 38
38 -
 39
39 -
 40
40 -
 41
41 -
 42
42 -
 43
43 -
 44
44 -
 45
45 -
 46
46 -
 47
47 -
 48
48 -
 49
49 -
 50
50 -
 51
51 -
 52
52 -
 53
53 -
 54
54 -
 55
55 -
 56
56 -
 57
57 -
 58
58 -
 59
59 -
 60
60 -
 61
61 -
 62
62 -
 63
63 -
 64
64 -
 65
65 -
 66
66 -
 67
67 -
 68
68 -
 69
69 -
 70
70 -
 71
71 -
 72
72 -
 73
73 -
 74
74 -
 75
75 -
 76
76 -
 77
77 -
 78
78 -
 79
79 -
 80
80 -
 81
81 -
 82
82 -
 83
83 -
 84
84 -
 85
85 -
 86
86 -
 87
87 -
 88
88 -
 89
89 -
 90
90 -
 91
91 -
 92
92 -
 93
93 -
 94
94 -
 95
95 -
 96
96 -
 97
97 -
 98
98 -
 99
99 -
 100
100 -
 101
101 -
 102
102 -
 103
103 -
 104
104 -
 105
105 -
 106
106 -
 107
107 -
 108
108 -
 109
109 -
 110
110 -
 111
111 -
 112
112 -
 113
113 -
 114
114 -
 115
115 -
 116
116 -
 117
117 -
 118
118 -
 119
119 -
 120
120 -
 121
121 -
 122
122 -
 123
123 -
 124
124 -
 125
125 -
 126
126 -
 127
127 -
 128
128 -
 129
129 -
 130
130 -
 131
131 -
 132
132 -
 133
133 -
 134
134 -
 135
135 -
 136
136 -
 137
137 -
 138
138 -
 139
139 -
 140
140 -
 141
141 -
 142
142 -
 143
143 -
 144
144 -
 145
145 -
 146
146 -
 147
147 -
 148
148 -
 149
149 -
 150
150 -
 151
151 -
 152
152 -
 153
153 -
 154
154 -
 155
155 -
 156
156 -
 157
157 -
 158
158 -
 159
159 -
 160
160 -
 161
161 -
 162
162 -
 163
163 -
 164
164 -
 165
165 -
 166
166 -
 167
167 -
 168
168 -
 169
169 -
 170
170 -
 171
171 -
 172
172 -
 173
173 -
 174
174 -
 175
175 -
 176
176 -
 177
177 -
 178
178 -
 179
179 -
 180
180 -
 181
181 -
 182
182 -
 183
183 -
 184
184 -
 185
185 -
 186
186 -
 187
187 -
 188
188 -
 189
189 -
 190
190 -
 191
191 -
 192
192 -
 193
193 -
 194
194 -
 195
195 -
 196
196 -
 197
197 -
 198
198 -
 199
199 -
 200
200 -
 201
201 -
 202
202 -
 203
203 -
 204
204 -
 205
205 -
 206
206 -
 207
207 -
 208
208 -
 209
209 -
 210
210 -
 211
211 -
 212
212 -
 213
213 -
 214
214 -
 215
215 -
 216
216 -
 217
217 -
 218
218 -
 219
219 -
 220
220 -
 221
221 -
 222
222 -
 223
223 -
 224
224 -
 225
225 -
 226
226 -
 227
227 -
 228
228 -
 229
229 -
 230
230 -
 231
231 -
 232
232 -
 233
233 -
 234
234 -
 235
235 -
 236
236 -
 237
237 -
 238
238 -
 239
239 -
 240
240 -
 241
241 -
 242
242 -
 243
243 -
 244
244 -
 245
245 -
 246
246 -
 247
247 -
 248
248 -
 249
249 -
 250
250 -
 251
251 -
 252
252 -
 253
253 -
 254
254 -
 255
255 -
 256
256 -
 257
257 -
 258
258 -
 259
259 -
 260
260 -
 261
261 -
 262
262 -
 263
263 -
 264
264 -
 265
265 -
 266
266 -
 267
267 -
 268
268 -
 269
269 -
 270
270 -
 271
271 -
 272
272 -
 273
273 -
 274
274 -
 275
275 -
 276
276 -
 277
277 -
 278
278 -
 279
279 -
 280
280 -
 281
281 -
 282
282 -
 283
283 -
 284
284 -
 285
285 -
 286
286 -
 287
287 -
 288
288 -
 289
289 -
 290
290 -
 291
291 -
 292
292 -
 293
293 -
 294
294 -
 295
295 -
 296
296 -
 297
297 -
 298
298 -
 299
299 -
 300
300 -
 301
301 -
 302
302 -
 303
303 -
 304
304 -
 305
305 -
 306
306 -
 307
307 -
 308
308 -
 309
309 -
 310
310 -
 311
311 -
 312
312 -
 313
313 -
 314
314 -
 315
315 -
 316
316 -
 317
317 -
 318
318 -
 319
319 -
 320
320 -
 321
321 -
 322
322 -
 323
323 -
 324
324 -
 325
325 -
 326
326 -
 327
327
 |
 |

282
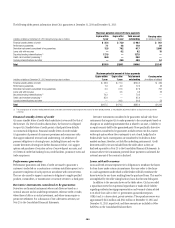
The following table provides information about corporate and consumer loans of consolidated VIEs carried at fair value at December 31, 2014 and 2013:
December 31, 2014 December 31, 2013
In millions of dollars Corporate loans Consumer loans Corporate loans Consumer loans
Carrying amount reported on the Consolidated Balance Sheet $— $— $14 $910
Aggregate unpaid principal balance in excess of fair value 9 — 7 212
Balance of non-accrual loans or loans more than 90 days past due — — — 81
Aggregate unpaid principal balance in excess of fair value for non-accrual
loans or loans more than 90 days past due — — — 106
Certain structured liabilities
The Company has elected the fair value option for certain structured
liabilities whose performance is linked to structured interest rates, inflation,
currency, equity, referenced credit or commodity risks (structured liabilities).
The Company elected the fair value option, because these exposures are
considered to be trading-related positions and, therefore, are managed on a
fair value basis. These positions will continue to be classified as debt, deposits
or derivatives (Trading account liabilities) on the Company’s Consolidated
Balance Sheet according to their legal form.
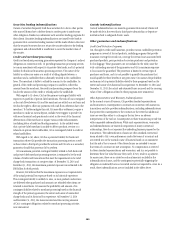
The following table provides information about the carrying value of structured notes, disaggregated by type of embedded derivative instrument at December 31,
2014 and 2013:
In billions of dollars December 31, 2014 December 31, 2013
Interest rate linked $10.9 $ 9.8
Foreign exchange linked 0.3 0.5
Equity linked 8.0 7.0
Commodity linked 1.4 1.8
Credit linked 2.5 3.5
Total $23.1 $22.6
The change in fair value of these structured liabilities is reported in
Principal transactions in the Company’s Consolidated Statement of Income.
Changes in fair value of these structured liabilities include an economic
component for accrued interest, which is included in the change in fair value
reported in Principal transactions.
Certain non-structured liabilities
The Company has elected the fair value option for certain non-structured
liabilities with fixed and floating interest rates (non-structured liabilities).
The Company has elected the fair value option where the interest-rate risk
of such liabilities is economically hedged with derivative contracts or the
proceeds are used to purchase financial assets that will also be accounted
for at fair value through earnings. The election has been made to mitigate
accounting mismatches and to achieve operational simplifications. These
positions are reported in Short-term borrowings and Long-term debt on
the Company’s Consolidated Balance Sheet. The change in fair value of
these non-structured liabilities is reported in Principal transactions in the
Company’s Consolidated Statement of Income. Related interest expense on
non-structured liabilities is measured based on the contractual interest rates
and reported as Interest expense in the Consolidated Statement of Income.
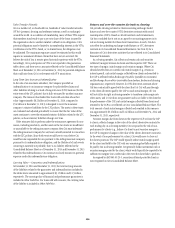
The following table provides information about long-term debt carried at fair value, excluding debt issued by consolidated VIEs, at December 31, 2014 and 2013:
In millions of dollars December 31, 2014 December 31, 2013
Carrying amount reported on the Consolidated Balance Sheet $26,180 $25,968
Aggregate unpaid principal balance in excess of (less than) fair value (151) (866)
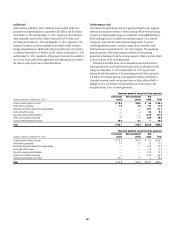
The following table provides information about short-term borrowings carried at fair value at December 31, 2014 and 2013:
In millions of dollars December 31, 2014 December 31, 2013
Carrying amount reported on the Consolidated Balance Sheet $1,496 $3,692
Aggregate unpaid principal balance in excess of (less than) fair value 31 (38)
