Citibank 2014 Annual Report Download - page 287
Download and view the complete annual report
Please find page 287 of the 2014 Citibank annual report below. You can navigate through the pages in the report by either clicking on the pages listed below, or by using the keyword search tool below to find specific information within the annual report.-
 1
1 -
2
-
3
-
4
-
5
-
6
-
7
-
8
-
9
-
10
-
11
-
12
-
13
-
14
-
15
-
16
-
17
-
18
-
19
-
20
-
21
-
22
-
23
-
24
-
25
-
26
-
27
-
28
-
29
-
30
-
31
-
32
-
33
-
34
-
35
-
36
-
37
-
38
-
39
-
40
-
41
-
42
-
43
-
44
-
45
-
46
-
47
-
48
-
49
-
50
-
51
-
52
-
53
-
54
-
55
-
56
-
57
-
58
-
59
-
60
-
61
-
62
-
63
-
64
-
65
-
66
-
67
-
68
-
69
-
70
-
71
-
72
-
73
-
74
-
75
-
76
-
77
-
78
-
79
-
80
-
81
-
82
-
83
-
84
-
85
-
86
-
87
-
88
-
89
-
90
-
91
-
92
-
93
-
94
-
95
-
96
-
97
-
98
-
99
-
100
-
101
-
102
-
103
-
104
-
105
-
106
-
107
-
108
-
109
-
110
-
111
-
112
-
113
-
114
-
115
-
116
-
117
-
118
-
119
-
120
-
121
-
122
-
123
-
124
-
125
-
126
-
127
-
128
-
129
-
130
-
131
-
132
-
133
-
134
-
135
-
136
-
137
-
138
-
139
-
140
-
141
-
142
-
143
-
144
-
145
-
146
-
147
-
148
-
149
-
150
-
151
-
152
-
153
-
154
-
155
-
156
-
157
-
158
-
159
-
160
-
161
-
162
-
163
-
164
-
165
-
166
-
167
-
168
-
169
-
170
-
171
-
172
-
173
-
174
-
175
-
176
-
177
-
178
-
179
-
180
-
181
-
182
-
183
-
184
-
185
-
186
-
187
-
188
-
189
-
190
-
191
-
192
-
193
-
194
-
195
-
196
-
197
-
198
-
199
-
200
-
201
-
202
-
203
-
204
-
205
-
206
-
207
-
208
-
209
-
210
-
211
-
212
-
213
-
214
-
215
-
216
-
217
-
218
-
219
-
220
-
221
-
222
-
223
-
224
-
225
-
226
-
227
-
228
-
229
-
230
-
231
-
232
-
233
-
234
-
235
-
236
-
237
-
238
-
239
-
240
-
241
-
242
-
243
-
244
-
245
-
246
-
247
-
248
-
249
-
250
-
251
-
252
-
253
-
254
-
255
-
256
-
257
-
258
-
259
-
260
-
261
-
262
-
263
-
264
-
265
-
266
-
267
-
268
-
269
-
270
-
271
-
272
-
273
-
274
-
275
-
276
-
 277
277 -
 278
278 -
 279
279 -
 280
280 -
 281
281 -
 282
282 -
 283
283 -
 284
284 -
 285
285 -
 286
286 -
 287
287 -
 288
288 -
 289
289 -
 290
290 -
 291
291 -
 292
292 -
 293
293 -
 294
294 -
 295
295 -
 296
296 -
 297
297 -
298
-
299
-
300
-
301
-
302
-
303
-
304
-
305
-
306
-
307
-
308
-
309
-
310
-
311
-
312
-
313
-
314
-
315
-
316
-
317
-
318
-
319
-
320
-
321
-
322
-
323
-
324
-
325
-
326
-
327
 |
 |

270
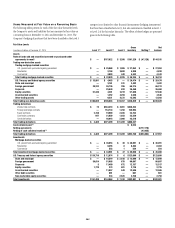
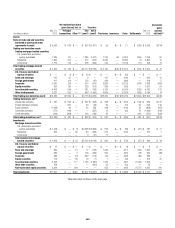
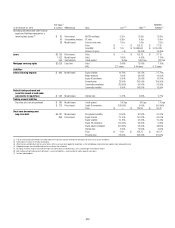
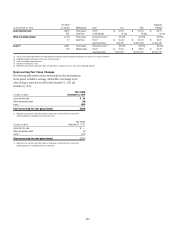
Valuation Techniques and Inputs for Level 3 Fair Value
Measurements
The Company’s Level 3 inventory consists of both cash securities and
derivatives of varying complexities. The valuation methodologies applied
to measure the fair value of these positions include discounted cash
flow analyses, internal models and comparative analysis. A position is
classified within Level 3 of the fair value hierarchy when at least one input
is unobservable and is considered significant to its valuation. The specific
reason an input is deemed unobservable varies. For example, at least one
significant input to the pricing model is not observable in the market, at least
one significant input has been adjusted to make it more representative of the
position being valued, or the price quote available does not reflect sufficient
trading activities.
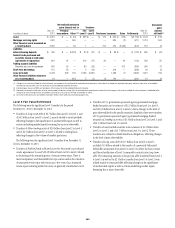
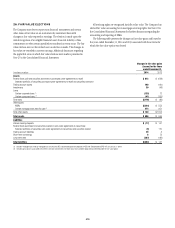
The following tables present the valuation techniques covering the
majority of Level 3 inventory and the most significant unobservable inputs
used in Level 3 fair value measurements as of December 31, 2014 and
December 31, 2013. Differences between this table and amounts presented
in the Level 3 Fair Value Rollforward table represent individually immaterial
items that have been measured using a variety of valuation techniques other
than those listed.
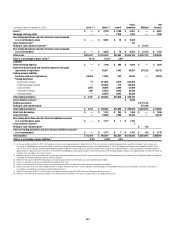
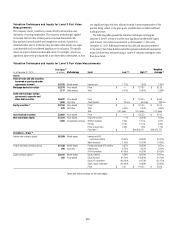
Valuation Techniques and Inputs for Level 3 Fair Value Measurements
As of December 31, 2014
Fair Value
(in millions)
(1)
Methodology Input Low (2)(3) High (2)(3)
Weighted
Average (4)
Assets
Federal funds sold and securities
borrowed or purchased under
agreements to resell $3,156 Model-based Interest rate 1.27% 1.97% 1.80%
Mortgage-backed securities $2,874 Price-based Price $ — $ 127.87 $ 81.43
1,117 Yield analysis Yield 0.01% 19.91% 5.89%
State and municipal, foreign
government, corporate and
other debt securities $5,937 Price-based Price $ — $ 124.00 $ 90.62
1,860 Cash flow Credit spread 25 bps 600 bps 233 bps
Equity securities (5) $2,163 Price-based Price (5) $ — $ 141.00 $ 91.00
679 Cash flow Yield 4.00% 5.00% 4.50%
WAL 0.01 years 3.14 years 1.07 years
Asset-backed securities $3,607 Price-based Price $ — $ 105.50 $ 67.01
Non-marketable equity $1,224 Price-based Discount to price —% 90.00% 4.04%
1,055 Comparables analysis EBITDA multiples 2.90x 13.10x 9.77x
PE ratio 8.10x 13.10x 8.43x
Price-to-book ratio 0.99x 1.56x 1.15x
Fund NAV (5) $ 1 $64,668,171 $29,975,777
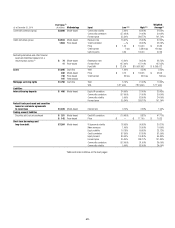
Derivatives—Gross (6)
Interest rate contracts (gross) $8,309 Model-based Interest rate (IR)
lognormal volatility 18.05% 90.65% 30.21%
Mean reversion 1.00% 20.00% 10.50%
Foreign exchange contracts (gross) $1,428 Model-based Foreign exchange (FX) volatility 0.37% 58.40% 8.57%
294 Cash flow Interest rate 3.72% 8.27% 5.02%
IR-FX correlation 40.00% 60.00% 50.00%
Equity contracts (gross) (7) $4,431 Model-based Equity volatility 9.56% 82.44% 24.61%
502 Price-based Equity forward 84.10% 100.80% 94.10%
Equity-FX correlation (88.20)% 48.70% (25.17)%
Equity-equity correlation (66.30)% 94.80% 36.87%
Price $ 0.01 $ 144.50 $ 93.05
Table and notes continue on the next pages.