Citibank 2014 Annual Report Download - page 134
Download and view the complete annual report
Please find page 134 of the 2014 Citibank annual report below. You can navigate through the pages in the report by either clicking on the pages listed below, or by using the keyword search tool below to find specific information within the annual report.-
 1
1 -
2
-
3
-
4
-
5
-
6
-
7
-
8
-
9
-
10
-
11
-
12
-
13
-
14
-
15
-
16
-
17
-
18
-
19
-
20
-
21
-
22
-
23
-
24
-
25
-
26
-
27
-
28
-
29
-
30
-
31
-
32
-
33
-
34
-
35
-
36
-
37
-
38
-
39
-
40
-
41
-
42
-
43
-
44
-
45
-
46
-
47
-
48
-
49
-
50
-
51
-
52
-
53
-
54
-
55
-
56
-
57
-
58
-
59
-
60
-
61
-
62
-
63
-
64
-
65
-
66
-
67
-
68
-
69
-
70
-
71
-
72
-
73
-
74
-
75
-
76
-
77
-
78
-
79
-
80
-
81
-
82
-
83
-
84
-
85
-
86
-
87
-
88
-
89
-
90
-
91
-
92
-
93
-
94
-
95
-
96
-
97
-
98
-
99
-
100
-
101
-
102
-
103
-
104
-
105
-
106
-
107
-
108
-
109
-
110
-
111
-
112
-
113
-
114
-
115
-
116
-
117
-
118
-
119
-
120
-
121
-
122
-
123
-
 124
124 -
 125
125 -
 126
126 -
 127
127 -
 128
128 -
 129
129 -
 130
130 -
 131
131 -
 132
132 -
 133
133 -
 134
134 -
 135
135 -
 136
136 -
 137
137 -
 138
138 -
 139
139 -
 140
140 -
 141
141 -
 142
142 -
 143
143 -
 144
144 -
145
-
146
-
147
-
148
-
149
-
150
-
151
-
152
-
153
-
154
-
155
-
156
-
157
-
158
-
159
-
160
-
161
-
162
-
163
-
164
-
165
-
166
-
167
-
168
-
169
-
170
-
171
-
172
-
173
-
174
-
175
-
176
-
177
-
178
-
179
-
180
-
181
-
182
-
183
-
184
-
185
-
186
-
187
-
188
-
189
-
190
-
191
-
192
-
193
-
194
-
195
-
196
-
197
-
198
-
199
-
200
-
201
-
202
-
203
-
204
-
205
-
206
-
207
-
208
-
209
-
210
-
211
-
212
-
213
-
214
-
215
-
216
-
217
-
218
-
219
-
220
-
221
-
222
-
223
-
224
-
225
-
226
-
227
-
228
-
229
-
230
-
231
-
232
-
233
-
234
-
235
-
236
-
237
-
238
-
239
-
240
-
241
-
242
-
243
-
244
-
245
-
246
-
247
-
248
-
249
-
250
-
251
-
252
-
253
-
254
-
255
-
256
-
257
-
258
-
259
-
260
-
261
-
262
-
263
-
264
-
265
-
266
-
267
-
268
-
269
-
270
-
271
-
272
-
273
-
274
-
275
-
276
-
277
-
278
-
279
-
280
-
281
-
282
-
283
-
284
-
285
-
286
-
287
-
288
-
289
-
290
-
291
-
292
-
293
-
294
-
295
-
296
-
297
-
298
-
299
-
300
-
301
-
302
-
303
-
304
-
305
-
306
-
307
-
308
-
309
-
310
-
311
-
312
-
313
-
314
-
315
-
316
-
317
-
318
-
319
-
320
-
321
-
322
-
323
-
324
-
325
-
326
-
327
 |
 |
117
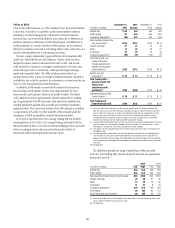
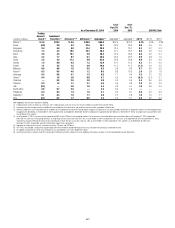
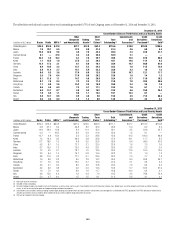
As of December 31, 2014
As of
Sept. 30,
2014
As of
Dec. 31,
2013 GCB NCL Rate
In billions of dollars
Trading
Account
Assets (1)
Investment
Securities (2) ICG Loans (3)(4) GCB Loans (3) Aggregate (5) Aggregate (5) Aggregate (5) 4Q’14 3Q’14 4Q’13
Mexico (6) $ 2.8 $20.3 $ 9.0 $28.0 $60.0 $67.6 $74.2 5.7% 4.9% 4.2%
Korea (0.9) 9.9 3.2 23.5 35.7 39.0 39.9 0.8 0.9 1.2
Singapore 0.4 5.9 8.0 14.4 28.8 31.4 29.1 0.2 0.2 0.3
Hong Kong 1.3 4.2 10.2 10.7 26.3 27.1 25.7 0.5 0.6 0.4
Brazil 3.8 3.4 15.1 3.9 26.2 27.4 25.6 6.8 5.5 5.7
India 2.2 7.7 9.7 6.1 25.6 25.2 25.7 0.9 0.8 1.0
China 2.5 3.5 11.2 4.9 22.0 22.3 20.8 0.9 0.3 0.6
Taiwan 1.4 0.9 4.4 7.2 13.9 14.1 14.4 0.2 0.1 0.2
Poland 1.1 4.5 1.5 2.9 10.0 11.2 11.2 (1.7) 0.2 0.2
Malaysia 0.8 0.6 1.6 5.5 8.5 9.4 8.9 0.7 0.6 0.6
Russia (7) 0.3 0.5 4.6 1.2 6.5 8.8 10.3 2.8 2.8 1.8
Indonesia 0.2 0.8 4.1 1.3 6.5 7.1 6.4 3.3 2.2 2.0
Turkey (8) 0.4 1.8 2.8 0.8 5.7 5.4 4.9 (0.1) (0.1) 0.1
Colombia — 0.4 2.5 2.0 4.9 5.2 5.4 3.4 3.5 4.9
Thailand 0.3 1.2 1.1 2.1 4.6 4.9 4.8 2.8 2.6 2.0
UAE (0.1) — 3.0 1.5 4.4 4.3 4.1 1.9 2.6 2.4
South Africa 0.6 0.7 2.0 — 3.3 3.0 2.0 —— —
Philippines 0.4 0.4 1.3 1.0 3.1 3.2 3.1 3.8 4.2 3.3
Argentina (7) 0.1 0.3 1.5 1.1 3.0 2.7 2.8 1.0 1.0 1.1
Peru (0.1) 0.2 1.7 0.5 2.2 2.2 2.1 3.6 3.5 3.3
Note: Aggregate may not cross-foot due to rounding.
(1) Trading account assets are shown on a net basis. Citi’s trading account assets will vary as it maintains inventory consistent with customer needs.
(2) Investment securities include securities available-for-sale, recorded at fair market value, and securities held-to-maturity, recorded at historical cost.
(3) Reflects funded loans, net of unearned income. In addition to the funded loans disclosed in the table above, through its ICG businesses, Citi had unfunded commitments to corporate customers in the emerging markets
of approximately $34 billion as of December 31, 2014 (approximately unchanged from September 30, 2014 and down from approximately $37 billion as of December 31, 2013); no single country accounted for more
than $4 billion of this amount.
(4) As of December 31, 2014, non-accrual loans represented 0.6% of total ICG loans in the emerging markets. For the countries in the table above, non-accrual loan ratios as of December 31, 2014 ranged from
0.0% to 0.4%, other than in Hong Kong and Brazil. In Hong Kong, the non-accrual loan ratio was 1.6% as of December 31, 2014 (compared to 1.5% and 2.5% as of September 30, 2014 and December 31, 2013,
respectively), primarily reflecting the impact of one counterparty. In Brazil, the non-accrual loan ratio was 1.0% as of December 31, 2014 (compared to 1.6% and 0.3% as of September 30, 2014 and
December 31, 2013, respectively), primarily reflecting the impact of one counterparty.
(5) Aggregate of Trading account assets, Investment securities, ICG loans and GCB loans.
(6) 4Q’14 NCL rate included a charge-off of approximately $70 million related to homebuilder exposure that was fully offset with previously established reserves.
(7) For additional information on certain risks relating to Russia and Argentina, see “Cross-Border Risk” below.
(8) Investment securities in Turkey include Citi’s remaining $1.6 billion investment in Akbank T.A.S. For additional information, see Note 14 to the Consolidated Financial Statements.