Citibank 2014 Annual Report Download - page 239
Download and view the complete annual report
Please find page 239 of the 2014 Citibank annual report below. You can navigate through the pages in the report by either clicking on the pages listed below, or by using the keyword search tool below to find specific information within the annual report.-
 1
1 -
2
-
3
-
4
-
5
-
6
-
7
-
8
-
9
-
10
-
11
-
12
-
13
-
14
-
15
-
16
-
17
-
18
-
19
-
20
-
21
-
22
-
23
-
24
-
25
-
26
-
27
-
28
-
29
-
30
-
31
-
32
-
33
-
34
-
35
-
36
-
37
-
38
-
39
-
40
-
41
-
42
-
43
-
44
-
45
-
46
-
47
-
48
-
49
-
50
-
51
-
52
-
53
-
54
-
55
-
56
-
57
-
58
-
59
-
60
-
61
-
62
-
63
-
64
-
65
-
66
-
67
-
68
-
69
-
70
-
71
-
72
-
73
-
74
-
75
-
76
-
77
-
78
-
79
-
80
-
81
-
82
-
83
-
84
-
85
-
86
-
87
-
88
-
89
-
90
-
91
-
92
-
93
-
94
-
95
-
96
-
97
-
98
-
99
-
100
-
101
-
102
-
103
-
104
-
105
-
106
-
107
-
108
-
109
-
110
-
111
-
112
-
113
-
114
-
115
-
116
-
117
-
118
-
119
-
120
-
121
-
122
-
123
-
124
-
125
-
126
-
127
-
128
-
129
-
130
-
131
-
132
-
133
-
134
-
135
-
136
-
137
-
138
-
139
-
140
-
141
-
142
-
143
-
144
-
145
-
146
-
147
-
148
-
149
-
150
-
151
-
152
-
153
-
154
-
155
-
156
-
157
-
158
-
159
-
160
-
161
-
162
-
163
-
164
-
165
-
166
-
167
-
168
-
169
-
170
-
171
-
172
-
173
-
174
-
175
-
176
-
177
-
178
-
179
-
180
-
181
-
182
-
183
-
184
-
185
-
186
-
187
-
188
-
189
-
190
-
191
-
192
-
193
-
194
-
195
-
196
-
197
-
198
-
199
-
200
-
201
-
202
-
203
-
204
-
205
-
206
-
207
-
208
-
209
-
210
-
211
-
212
-
213
-
214
-
215
-
216
-
217
-
218
-
219
-
220
-
221
-
222
-
223
-
224
-
225
-
226
-
227
-
228
-
 229
229 -
 230
230 -
 231
231 -
 232
232 -
 233
233 -
 234
234 -
 235
235 -
 236
236 -
 237
237 -
 238
238 -
 239
239 -
 240
240 -
 241
241 -
 242
242 -
 243
243 -
 244
244 -
 245
245 -
 246
246 -
 247
247 -
 248
248 -
 249
249 -
250
-
251
-
252
-
253
-
254
-
255
-
256
-
257
-
258
-
259
-
260
-
261
-
262
-
263
-
264
-
265
-
266
-
267
-
268
-
269
-
270
-
271
-
272
-
273
-
274
-
275
-
276
-
277
-
278
-
279
-
280
-
281
-
282
-
283
-
284
-
285
-
286
-
287
-
288
-
289
-
290
-
291
-
292
-
293
-
294
-
295
-
296
-
297
-
298
-
299
-
300
-
301
-
302
-
303
-
304
-
305
-
306
-
307
-
308
-
309
-
310
-
311
-
312
-
313
-
314
-
315
-
316
-
317
-
318
-
319
-
320
-
321
-
322
-
323
-
324
-
325
-
326
-
327
 |
 |

222
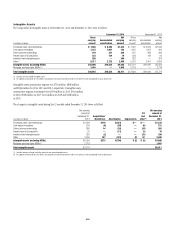
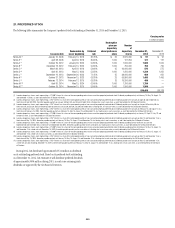
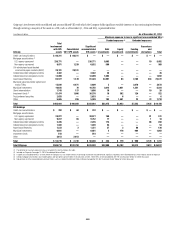
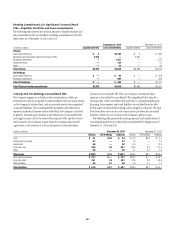
20. CHANGES IN ACCUMULATED OTHER COMPREHENSIVE INCOME (LOSS)
Changes in each component of Citigroup’s Accumulated other comprehensive income (loss) for the three years ended December 31, 2014 are as follows:
In millions of dollars
Net
unrealized
gains (losses)
on investment
securities
Cash flow
hedges (1)
Benefit
plans (2)
Foreign
currency
translation
adjustment,
net of
hedges
(CTA) (3)(4)
Accumulated
other
comprehensive
income (loss)
Balance, December 31, 2011 $ (35) $(2,820) $(4,282) $ (10,651) $ (17,788)
Change, net of taxes (5)(6) 632 527 (988) 721 892
Balance, December 31, 2012 $ 597 $(2,293) $(5,270) $ (9,930) $ (16,896)
Other comprehensive income before reclassifications $(1,962) $ 512 $ 1,098 $ (2,534) $ (2,886)
Increase (decrease) due to amounts reclassified from AOCI (7) (275) 536 183 205 649
Change, net of taxes (7) $(2,237) $ 1,048 $ 1,281 $ (2,329) $ (2,237)
Balance, December 31, 2013 $(1,640) $(1,245) $(3,989) $ (12,259) $ (19,133)
Other comprehensive income before reclassifications $ 1,790 $ 85 $(1,346) $ (4,946) $ (4,417)
Increase (decrease) due to amounts reclassified from AOCI (93) 251 176 — 334
Change, net of taxes $ 1,697 $ 336 $(1,170) $ (4,946) $ (4,083)
Balance at December 31, 2014 $ 57 $ (909) $(5,159) $(17,205) $(23,216)
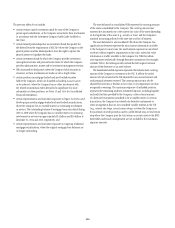
(1) Primarily driven by Citigroup’s pay fixed/receive floating interest rate swap programs that hedge the floating rates on liabilities.
(2) Primarily reflects adjustments based on the quarterly actuarial valuations of the Company’s significant pension and postretirement plans, annual actuarial valuations of all other plans, and amortization of amounts
previously recognized in other comprehensive income. Reflects the adoption of new mortality tables effective December 31, 2014 (see Note 8 to the Consolidated Financial Statements).
(3) Primarily reflects the movements in (by order of impact) the Mexican peso, euro, Japanese yen, and Russian ruble against the U.S. dollar, and changes in related tax effects and hedges for the year ended
December 31, 2014. Primarily reflects the movements in (by order of impact) the Japanese yen, Mexican peso, Australian dollar, and Indian rupee against the U.S. dollar, and changes in related tax effects and hedges
for the year ended December 31, 2013. Primarily reflects the movements in (by order of impact) the Mexican peso, Japanese yen, euro, and Brazilian real against the U.S. dollar, and changes in related tax effects and
hedges for the year ended December 31, 2012.
(4) During 2014, $137 million ($84 million net of tax) was reclassified to reflect the allocation of foreign currency translation between net unrealized gains (losses) on investment securities to CTA.
(5) Includes the after-tax impact of realized gains from the sales of minority investments: $672 million from the Company’s entire interest in Housing Development Finance Corporation Ltd. (HDFC); and $421 million from
the Company’s entire interest in Shanghai Pudong Development Bank (SPDB).
(6) The after-tax impact due to impairment charges and the loss related to Akbank included within the foreign currency translation adjustment, during 2012 was $667 million (see Note 14 to the Consolidated
Financial Statements).
(7) On December 20, 2013, the sale of Credicard was completed (see Note 2 to the Consolidated Financial Statements). The total impact to the gross CTA (net CTA including hedges) was a pretax loss of $314 million
($205 million net of tax).
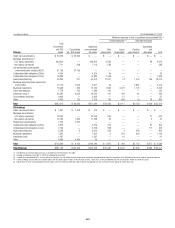
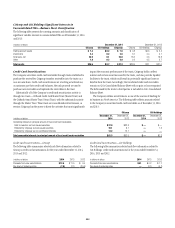
The pretax and after-tax changes in each component of Accumulated other comprehensive income (loss) for the three years ended December 31, 2014
are as follows:
In millions of dollars Pretax Tax effect After-tax
Balance, December 31, 2011 $ (25,807) $ 8,019 $ (17,788)
Change in net unrealized gains (losses) on investment securities 1,001 (369) 632
Cash flow hedges 838 (311) 527
Benefit plans (1,378) 390 (988)
Foreign currency translation adjustment 12 709 721
Change $ 473 $ 419 $ 892
Balance, December 31, 2012 $ (25,334) $ 8,438 $ (16,896)
Change in net unrealized gains (losses) on investment securities (3,537) 1,300 (2,237)
Cash flow hedges 1,673 (625) 1,048
Benefit plans 1,979 (698) 1,281
Foreign currency translation adjustment (2,377) 48 (2,329)
Change $ (2,262) $ 25 $ (2,237)
Balance, December 31, 2013 $ (27,596) $ 8,463 $ (19,133)
Change in net unrealized gains (losses) on investment securities 2,704 (1,007) 1,697
Cash flow hedges 543 (207) 336
Benefit plans (1,830) 660 (1,170)
Foreign currency translation adjustment (4,881) (65) (4,946)
Change $ (3,464) $ (619) $ (4,083)
Balance, December 31, 2014 $(31,060) $ 7,844 $(23,216)