Citibank 2014 Annual Report Download - page 220
Download and view the complete annual report
Please find page 220 of the 2014 Citibank annual report below. You can navigate through the pages in the report by either clicking on the pages listed below, or by using the keyword search tool below to find specific information within the annual report.-
 1
1 -
2
-
3
-
4
-
5
-
6
-
7
-
8
-
9
-
10
-
11
-
12
-
13
-
14
-
15
-
16
-
17
-
18
-
19
-
20
-
21
-
22
-
23
-
24
-
25
-
26
-
27
-
28
-
29
-
30
-
31
-
32
-
33
-
34
-
35
-
36
-
37
-
38
-
39
-
40
-
41
-
42
-
43
-
44
-
45
-
46
-
47
-
48
-
49
-
50
-
51
-
52
-
53
-
54
-
55
-
56
-
57
-
58
-
59
-
60
-
61
-
62
-
63
-
64
-
65
-
66
-
67
-
68
-
69
-
70
-
71
-
72
-
73
-
74
-
75
-
76
-
77
-
78
-
79
-
80
-
81
-
82
-
83
-
84
-
85
-
86
-
87
-
88
-
89
-
90
-
91
-
92
-
93
-
94
-
95
-
96
-
97
-
98
-
99
-
100
-
101
-
102
-
103
-
104
-
105
-
106
-
107
-
108
-
109
-
110
-
111
-
112
-
113
-
114
-
115
-
116
-
117
-
118
-
119
-
120
-
121
-
122
-
123
-
124
-
125
-
126
-
127
-
128
-
129
-
130
-
131
-
132
-
133
-
134
-
135
-
136
-
137
-
138
-
139
-
140
-
141
-
142
-
143
-
144
-
145
-
146
-
147
-
148
-
149
-
150
-
151
-
152
-
153
-
154
-
155
-
156
-
157
-
158
-
159
-
160
-
161
-
162
-
163
-
164
-
165
-
166
-
167
-
168
-
169
-
170
-
171
-
172
-
173
-
174
-
175
-
176
-
177
-
178
-
179
-
180
-
181
-
182
-
183
-
184
-
185
-
186
-
187
-
188
-
189
-
190
-
191
-
192
-
193
-
194
-
195
-
196
-
197
-
198
-
199
-
200
-
201
-
202
-
203
-
204
-
205
-
206
-
207
-
208
-
209
-
 210
210 -
 211
211 -
 212
212 -
 213
213 -
 214
214 -
 215
215 -
 216
216 -
 217
217 -
 218
218 -
 219
219 -
 220
220 -
 221
221 -
 222
222 -
 223
223 -
 224
224 -
 225
225 -
 226
226 -
 227
227 -
 228
228 -
 229
229 -
 230
230 -
231
-
232
-
233
-
234
-
235
-
236
-
237
-
238
-
239
-
240
-
241
-
242
-
243
-
244
-
245
-
246
-
247
-
248
-
249
-
250
-
251
-
252
-
253
-
254
-
255
-
256
-
257
-
258
-
259
-
260
-
261
-
262
-
263
-
264
-
265
-
266
-
267
-
268
-
269
-
270
-
271
-
272
-
273
-
274
-
275
-
276
-
277
-
278
-
279
-
280
-
281
-
282
-
283
-
284
-
285
-
286
-
287
-
288
-
289
-
290
-
291
-
292
-
293
-
294
-
295
-
296
-
297
-
298
-
299
-
300
-
301
-
302
-
303
-
304
-
305
-
306
-
307
-
308
-
309
-
310
-
311
-
312
-
313
-
314
-
315
-
316
-
317
-
318
-
319
-
320
-
321
-
322
-
323
-
324
-
325
-
326
-
327
 |
 |

203
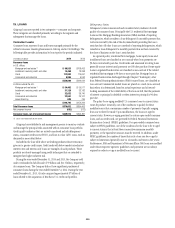
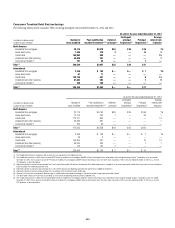
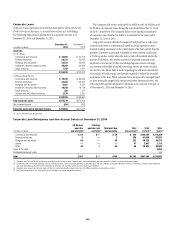
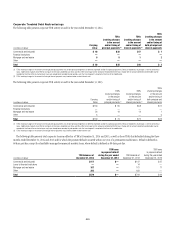
As a result of OCC guidance issued in the third quarter of 2012, mortgage
loans to borrowers who have gone through Chapter 7 bankruptcy are
classified as troubled debt restructurings (TDRs). These TDRs, other than
FHA-insured loans, are written down to collateral value less cost to sell. FHA-
insured loans are reserved based on a discounted cash flow model.
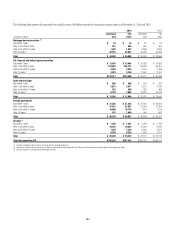
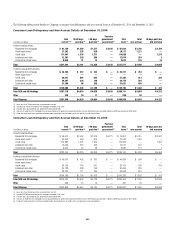
The following tables present information about total impaired consumer
loans at and for the periods ended December 31, 2014 and 2013, respectively,
and for the years ended December 31, 2014 and 2013 for interest income
recognized on impaired consumer loans:
At and for the year ended December 31, 2014
In millions of dollars
Recorded
investment (1)(2)
Unpaid
principal balance
Related
specific
allowance (3)
Average
carrying value (4)
Interest income
recognized (5)(6)
Mortgage and real estate
Residential first mortgages $13,551 $14,387 $ 1,909 $15,389 $ 690
Home equity loans 2,029 2,674 599 2,075 74
Credit cards 2,407 2,447 849 2,732 196
Installment and other
Individual installment and other 948 963 450 975 124
Commercial market loans 423 599 110 381 22
Total $19,358 $21,070 $ 3,917 $21,552 $1,106
(1) Recorded investment in a loan includes net deferred loan fees and costs, unamortized premium or discount and direct write-downs and includes accrued interest only on credit card loans.
(2) $1,896 million of residential first mortgages, $554 million of home equity loans and $158 million of commercial market loans do not have a specific allowance.
(3) Included in the Allowance for loan losses.
(4) Average carrying value represents the average recorded investment ending balance for the last four quarters and does not include the related specific allowance.
(5) Includes amounts recognized on both an accrual and cash basis.
(6) Cash interest receipts on smaller-balance homogeneous loans are generally recorded as revenue. The interest recognition policy for commercial market loans is identical to that for corporate loans, as described below.
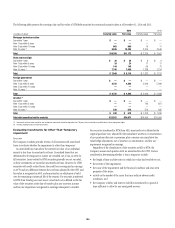
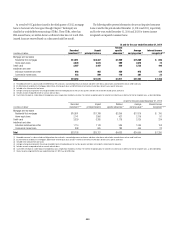
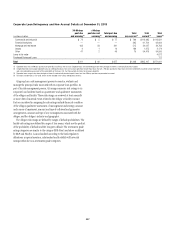
At and for the year ended December 31, 2013
In millions of dollars
Recorded
investment (1)(2)
Unpaid
principal balance
Related
specific allowance (3)
Average
carrying value (4)
Interest income
recognized (5)(6)(7)
Mortgage and real estate
Residential first mortgages $16,801 $17,788 $ 2,309 $17,616 $ 790
Home equity loans 2,141 2,806 427 2,116 81
Credit cards 3,339 3,385 1,178 3,720 234
Installment and other
Individual installment and other 1,114 1,143 536 1,094 153
Commercial market loans 398 605 183 404 22
Total $23,793 $25,727 $ 4,633 $24,950 $ 1,280
(1) Recorded investment in a loan includes net deferred loan fees and costs, unamortized premium or discount and direct write-downs and includes accrued interest only on credit card loans.
(2) $2,169 million of residential first mortgages, $568 million of home equity loans and $111 million of commercial market loans do not have a specific allowance.
(3) Included in the Allowance for loan losses.
(4) Average carrying value represents the average recorded investment ending balance for last four quarters and does not include the related specific allowance.
(5) Includes amounts recognized on both an accrual and cash basis.
(6) Cash interest receipts on smaller-balance homogeneous loans are generally recorded as revenue. The interest recognition policy for commercial market loans is identical to that for corporate loans, as described below.
(7) Interest income recognized for the year ended December 31, 2012 was $1,520 million.