Citibank 2014 Annual Report Download - page 137
Download and view the complete annual report
Please find page 137 of the 2014 Citibank annual report below. You can navigate through the pages in the report by either clicking on the pages listed below, or by using the keyword search tool below to find specific information within the annual report.-
 1
1 -
2
-
3
-
4
-
5
-
6
-
7
-
8
-
9
-
10
-
11
-
12
-
13
-
14
-
15
-
16
-
17
-
18
-
19
-
20
-
21
-
22
-
23
-
24
-
25
-
26
-
27
-
28
-
29
-
30
-
31
-
32
-
33
-
34
-
35
-
36
-
37
-
38
-
39
-
40
-
41
-
42
-
43
-
44
-
45
-
46
-
47
-
48
-
49
-
50
-
51
-
52
-
53
-
54
-
55
-
56
-
57
-
58
-
59
-
60
-
61
-
62
-
63
-
64
-
65
-
66
-
67
-
68
-
69
-
70
-
71
-
72
-
73
-
74
-
75
-
76
-
77
-
78
-
79
-
80
-
81
-
82
-
83
-
84
-
85
-
86
-
87
-
88
-
89
-
90
-
91
-
92
-
93
-
94
-
95
-
96
-
97
-
98
-
99
-
100
-
101
-
102
-
103
-
104
-
105
-
106
-
107
-
108
-
109
-
110
-
111
-
112
-
113
-
114
-
115
-
116
-
117
-
118
-
119
-
120
-
121
-
122
-
123
-
124
-
125
-
126
-
 127
127 -
 128
128 -
 129
129 -
 130
130 -
 131
131 -
 132
132 -
 133
133 -
 134
134 -
 135
135 -
 136
136 -
 137
137 -
 138
138 -
 139
139 -
 140
140 -
 141
141 -
 142
142 -
 143
143 -
 144
144 -
 145
145 -
 146
146 -
 147
147 -
148
-
149
-
150
-
151
-
152
-
153
-
154
-
155
-
156
-
157
-
158
-
159
-
160
-
161
-
162
-
163
-
164
-
165
-
166
-
167
-
168
-
169
-
170
-
171
-
172
-
173
-
174
-
175
-
176
-
177
-
178
-
179
-
180
-
181
-
182
-
183
-
184
-
185
-
186
-
187
-
188
-
189
-
190
-
191
-
192
-
193
-
194
-
195
-
196
-
197
-
198
-
199
-
200
-
201
-
202
-
203
-
204
-
205
-
206
-
207
-
208
-
209
-
210
-
211
-
212
-
213
-
214
-
215
-
216
-
217
-
218
-
219
-
220
-
221
-
222
-
223
-
224
-
225
-
226
-
227
-
228
-
229
-
230
-
231
-
232
-
233
-
234
-
235
-
236
-
237
-
238
-
239
-
240
-
241
-
242
-
243
-
244
-
245
-
246
-
247
-
248
-
249
-
250
-
251
-
252
-
253
-
254
-
255
-
256
-
257
-
258
-
259
-
260
-
261
-
262
-
263
-
264
-
265
-
266
-
267
-
268
-
269
-
270
-
271
-
272
-
273
-
274
-
275
-
276
-
277
-
278
-
279
-
280
-
281
-
282
-
283
-
284
-
285
-
286
-
287
-
288
-
289
-
290
-
291
-
292
-
293
-
294
-
295
-
296
-
297
-
298
-
299
-
300
-
301
-
302
-
303
-
304
-
305
-
306
-
307
-
308
-
309
-
310
-
311
-
312
-
313
-
314
-
315
-
316
-
317
-
318
-
319
-
320
-
321
-
322
-
323
-
324
-
325
-
326
-
327
 |
 |

120
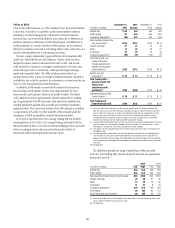
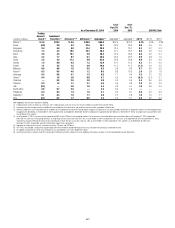
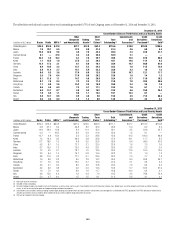
The tables below set forth each country whose total outstandings exceeded 0.75% of total Citigroup assets as of December 31, 2014 and December 31, 2013:
December 31, 2014
Cross-Border Claims on Third Parties and Local Country Assets
In billions of U.S. dollars Banks Public NBFIs (1)
Other
(Corporate
and Households)
Trading
Assets (2)
Short
Term
Claims (2)
Total
Outstanding (3)
Commitments
and
Guarantees (4)
Credit
Derivatives
Purchased (5)
Credit
Derivatives
Sold (5)
United Kingdom $23.9 $18.0 $47.0 $27.7 $12.8 $62.4 $116.6 $19.0 $104.0 $105.5
Mexico 7.9 29.7 6.5 37.3 8.9 41.4 81.4 4.6 6.8 6.4
Japan 12.8 32.0 9.6 4.6 7.0 42.3 59.0 4.3 22.6 21.7
Cayman Islands 0.1 — 47.5 3.3 2.0 35.8 50.9 2.1 — —
France 23.2 3.5 16.2 6.1 7.0 29.7 49.0 12.5 87.0 88.0
Korea 1.1 18.5 1.0 27.5 2.2 39.3 48.1 14.6 11.4 9.3
Germany 12.4 17.3 3.1 6.1 6.6 16.1 38.9 10.7 80.0 81.0
China 8.9 10.5 2.2 13.7 5.2 24.5 35.3 1.6 11.5 12.0
India 5.8 11.4 2.7 15.1 5.9 23.2 35.0 4.2 1.8 1.5
Australia 8.0 5.3 3.6 17.0 6.6 12.5 33.9 10.7 12.1 11.7
Singapore 2.5 7.9 6.4 17.0 0.6 20.2 33.8 1.8 1.4 1.3
Brazil 5.1 11.5 1.1 14.7 4.6 20.5 32.4 5.7 11.9 10.2
Netherlands 8.7 7.6 8.4 7.2 2.3 11.3 31.9 7.0 30.4 30.6
Hong Kong 1.1 8.0 2.6 15.2 3.4 15.9 26.9 2.4 2.6 1.9
Canada 6.6 4.5 6.0 7.3 4.7 11.1 24.4 7.6 6.7 7.1
Switzerland 5.0 13.7 0.7 4.0 0.4 16.2 23.4 4.6 25.9 26.4
Taiwan 1.9 6.9 1.1 9.8 1.7 13.3 19.7 13.3 0.1 —
Italy 2.0 12.1 0.8 0.9 4.6 5.9 15.8 3.5 71.3 68.3
Ireland 4.6 0.4 8.0 1.8 1.3 8.9 14.8 2.9 4.3 4.2
December 31, 2013
Cross-Border Claims on Third Parties and Local Country Assets
In billions of U.S. dollars Banks Public NBFIs (1)
Other
(Corporate
and Households)
Trading
Assets (2)
Short
Term
Claims (2)
Total
Outstanding (3)
Commitments
and
Guarantees (4)
Credit
Derivatives
Purchased (5)
Credit
Derivatives
Sold (5)
United Kingdom $29.4 $12.3 $37.8 $31.6 $14.5 $62.9 $111.1 $17.7 $ 119.2 $119.4
Mexico 6.8 37.1 5.9 40.8 8.2 42.5 90.6 5.4 6.2 6.3
Japan 14.9 29.0 12.8 6.4 11.4 45.0 63.1 3.5 23.8 22.7
Cayman Islands 0.2 — 46.5 6.6 2.9 41.8 53.3 1.3 0.1 —
France 19.7 2.8 13.9 5.9 5.3 28.8 42.3 12.3 100.6 98.8
Korea 1.5 16.3 0.5 28.9 2.8 35.8 47.2 19.1 11.7 9.5
Germany 11.7 18.5 1.9 4.8 6.5 20.3 36.9 9.4 98.6 97.6
China 9.3 8.7 1.9 12.7 3.1 23.0 32.6 1.6 7.3 7.6
India 6.7 10.9 1.3 15.0 4.8 23.1 33.9 3.8 2.2 2.0
Australia 7.2 4.0 5.1 18.1 7.5 13.6 34.4 11.9 15.5 14.6
Singapore 2.3 9.4 1.4 16.1 0.8 14.0 29.2 2.1 1.4 1.3
Brazil 3.8 11.0 0.3 17.1 5.1 23.6 32.2 7.3 7.7 7.3
Netherlands 7.6 8.6 3.3 6.5 2.8 14.2 26.0 8.0 35.8 35.1
Hong Kong 1.7 7.5 2.6 15.2 3.7 16.4 27.0 2.1 2.6 2.4
Canada 4.5 4.1 3.6 8.2 4.9 10.8 20.4 7.3 6.6 6.3
Switzerland 4.2 9.6 0.8 4.6 0.6 14.5 19.2 5.7 32.2 31.9
Taiwan 1.6 7.0 0.3 9.9 1.6 11.7 18.8 14.0 0.2 0.1
Italy 2.8 15.0 0.4 1.3 6.3 7.0 19.5 3.2 78.9 72.4
Ireland 5.0 0.7 4.0 1.5 1.5 8.1 11.2 2.6 4.1 4.1
(1) Non-bank financial institutions.
(2) Included in total outstanding.
(3) Total outstanding includes cross-border claims on third parties, as well as local country assets. Cross-border claims on third parties includes cross-border loans, securities, deposits with banks and other monetary
assets, as well as net revaluation gains on foreign exchange and derivative products.
(4) Commitments (not included in total outstanding) include legally binding cross-border letters of credit and other commitments and contingencies as defined by the FFIEC guidelines. The FFIEC definition of commitments
includes commitments to local residents to be funded with local currency liabilities originated within the country.
(5) CDS are not included in total outstanding.