Citibank 2014 Annual Report Download - page 156
Download and view the complete annual report
Please find page 156 of the 2014 Citibank annual report below. You can navigate through the pages in the report by either clicking on the pages listed below, or by using the keyword search tool below to find specific information within the annual report.-
 1
1 -
2
-
3
-
4
-
5
-
6
-
7
-
8
-
9
-
10
-
11
-
12
-
13
-
14
-
15
-
16
-
17
-
18
-
19
-
20
-
21
-
22
-
23
-
24
-
25
-
26
-
27
-
28
-
29
-
30
-
31
-
32
-
33
-
34
-
35
-
36
-
37
-
38
-
39
-
40
-
41
-
42
-
43
-
44
-
45
-
46
-
47
-
48
-
49
-
50
-
51
-
52
-
53
-
54
-
55
-
56
-
57
-
58
-
59
-
60
-
61
-
62
-
63
-
64
-
65
-
66
-
67
-
68
-
69
-
70
-
71
-
72
-
73
-
74
-
75
-
76
-
77
-
78
-
79
-
80
-
81
-
82
-
83
-
84
-
85
-
86
-
87
-
88
-
89
-
90
-
91
-
92
-
93
-
94
-
95
-
96
-
97
-
98
-
99
-
100
-
101
-
102
-
103
-
104
-
105
-
106
-
107
-
108
-
109
-
110
-
111
-
112
-
113
-
114
-
115
-
116
-
117
-
118
-
119
-
120
-
121
-
122
-
123
-
124
-
125
-
126
-
127
-
128
-
129
-
130
-
131
-
132
-
133
-
134
-
135
-
136
-
137
-
138
-
139
-
140
-
141
-
142
-
143
-
144
-
145
-
 146
146 -
 147
147 -
 148
148 -
 149
149 -
 150
150 -
 151
151 -
 152
152 -
 153
153 -
 154
154 -
 155
155 -
 156
156 -
 157
157 -
 158
158 -
 159
159 -
 160
160 -
 161
161 -
 162
162 -
 163
163 -
 164
164 -
 165
165 -
 166
166 -
167
-
168
-
169
-
170
-
171
-
172
-
173
-
174
-
175
-
176
-
177
-
178
-
179
-
180
-
181
-
182
-
183
-
184
-
185
-
186
-
187
-
188
-
189
-
190
-
191
-
192
-
193
-
194
-
195
-
196
-
197
-
198
-
199
-
200
-
201
-
202
-
203
-
204
-
205
-
206
-
207
-
208
-
209
-
210
-
211
-
212
-
213
-
214
-
215
-
216
-
217
-
218
-
219
-
220
-
221
-
222
-
223
-
224
-
225
-
226
-
227
-
228
-
229
-
230
-
231
-
232
-
233
-
234
-
235
-
236
-
237
-
238
-
239
-
240
-
241
-
242
-
243
-
244
-
245
-
246
-
247
-
248
-
249
-
250
-
251
-
252
-
253
-
254
-
255
-
256
-
257
-
258
-
259
-
260
-
261
-
262
-
263
-
264
-
265
-
266
-
267
-
268
-
269
-
270
-
271
-
272
-
273
-
274
-
275
-
276
-
277
-
278
-
279
-
280
-
281
-
282
-
283
-
284
-
285
-
286
-
287
-
288
-
289
-
290
-
291
-
292
-
293
-
294
-
295
-
296
-
297
-
298
-
299
-
300
-
301
-
302
-
303
-
304
-
305
-
306
-
307
-
308
-
309
-
310
-
311
-
312
-
313
-
314
-
315
-
316
-
317
-
318
-
319
-
320
-
321
-
322
-
323
-
324
-
325
-
326
-
327
 |
 |

139
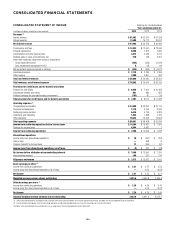
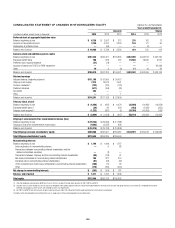
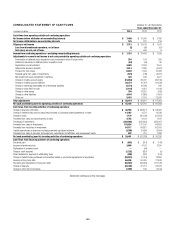
CONSOLIDATED STATEMENT OF CASH FLOWS Citigroup Inc. and Subsidiaries
Years ended December 31,
In millions of dollars 2014 2013 2012
Cash flows from operating activities of continuing operations
Net income before attribution of noncontrolling interests $ 7,498 $ 13,900 $ 7,760
Net income attributable to noncontrolling interests 185 227 219
Citigroup’s net income $ 7,313 $ 13,673 $ 7,541
Loss from discontinued operations, net of taxes (2) (90) (57)
Gain (loss) on sale, net of taxes — 360 (1)
Income from continuing operations—excluding noncontrolling interests $ 7,315 $ 13,403 $ 7,599
Adjustments to reconcile net income to net cash provided by operating activities of continuing operations
Amortization of deferred policy acquisition costs and present value of future profits 210 194 203
(Additions) reductions to deferred policy acquisition costs (64) (54) 85
Depreciation and amortization 3,589 3,303 2,507
Deferred tax provision (benefit) 3,014 2,380 (4,091)
Provision for loan losses 6,828 7,604 10,458
Realized gains from sales of investments (570) (748) (3,251)
Net impairment losses recognized in earnings 426 535 4,971
Change in trading account assets (10,858) 35,001 (29,195)
Change in trading account liabilities 30,274 (6,787) (10,533)
Change in brokerage receivables net of brokerage payables (4,272) (6,490) 945
Change in loans held-for-sale (1,144) 4,321 (1,106)
Change in other assets 709 13,332 (530)
Change in other liabilities 4,544 (7,880) (1,457)
Other, net 5,433 5,130 13,033
Total adjustments $ 38,119 $ 49,841 $ (17,961)
Net cash provided by (used in) operating activities of continuing operations $ 45,434 $ 63,244 $ (10,362)
Cash flows from investing activities of continuing operations
Change in deposits with banks $ 40,916 $ (66,871) $ 53,650
Change in federal funds sold and securities borrowed or purchased under agreements to resell 14,467 4,274 14,538
Change in loans 1,170 (30,198) (31,591)
Proceeds from sales and securitizations of loans 4,752 9,123 7,287
Purchases of investments (258,992) (220,823) (256,907)
Proceeds from sales of investments 135,824 131,100 143,853
Proceeds from maturities of investments 94,117 84,831 102,020
Capital expenditures on premises and equipment and capitalized software (3,386) (3,490) (3,604)
Proceeds from sales of premises and equipment, subsidiaries and affiliates, and repossessed assets 623 716 1,089
Net cash provided by (used in) investing activities of continuing operations $ 29,491 $ (91,338) $ 30,335
Cash flows from financing activities of continuing operations
Dividends paid $ (633) $ (314) $ (143)
Issuance of preferred stock 3,699 4,192 2,250
Redemption of preferred stock —(94) —
Treasury stock acquired (1,232) (837) (5)
Stock tendered for payment of withholding taxes (508) (452) (194)
Change in federal funds purchased and securities loaned or sold under agreements to repurchase (30,074) (7,724) 12,863
Issuance of long-term debt 66,836 54,405 27,843
Payments and redemptions of long-term debt (58,923) (63,994) (117,575)
Change in deposits (48,336) 37,713 64,624
Change in short-term borrowings (1,099) 199 (2,164)
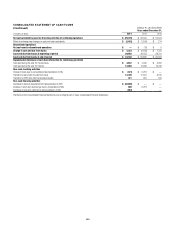
Statement continues on the next page.