Citibank 2014 Annual Report Download - page 199
Download and view the complete annual report
Please find page 199 of the 2014 Citibank annual report below. You can navigate through the pages in the report by either clicking on the pages listed below, or by using the keyword search tool below to find specific information within the annual report.-
 1
1 -
2
-
3
-
4
-
5
-
6
-
7
-
8
-
9
-
10
-
11
-
12
-
13
-
14
-
15
-
16
-
17
-
18
-
19
-
20
-
21
-
22
-
23
-
24
-
25
-
26
-
27
-
28
-
29
-
30
-
31
-
32
-
33
-
34
-
35
-
36
-
37
-
38
-
39
-
40
-
41
-
42
-
43
-
44
-
45
-
46
-
47
-
48
-
49
-
50
-
51
-
52
-
53
-
54
-
55
-
56
-
57
-
58
-
59
-
60
-
61
-
62
-
63
-
64
-
65
-
66
-
67
-
68
-
69
-
70
-
71
-
72
-
73
-
74
-
75
-
76
-
77
-
78
-
79
-
80
-
81
-
82
-
83
-
84
-
85
-
86
-
87
-
88
-
89
-
90
-
91
-
92
-
93
-
94
-
95
-
96
-
97
-
98
-
99
-
100
-
101
-
102
-
103
-
104
-
105
-
106
-
107
-
108
-
109
-
110
-
111
-
112
-
113
-
114
-
115
-
116
-
117
-
118
-
119
-
120
-
121
-
122
-
123
-
124
-
125
-
126
-
127
-
128
-
129
-
130
-
131
-
132
-
133
-
134
-
135
-
136
-
137
-
138
-
139
-
140
-
141
-
142
-
143
-
144
-
145
-
146
-
147
-
148
-
149
-
150
-
151
-
152
-
153
-
154
-
155
-
156
-
157
-
158
-
159
-
160
-
161
-
162
-
163
-
164
-
165
-
166
-
167
-
168
-
169
-
170
-
171
-
172
-
173
-
174
-
175
-
176
-
177
-
178
-
179
-
180
-
181
-
182
-
183
-
184
-
185
-
186
-
187
-
188
-
 189
189 -
 190
190 -
 191
191 -
 192
192 -
 193
193 -
 194
194 -
 195
195 -
 196
196 -
 197
197 -
 198
198 -
 199
199 -
 200
200 -
 201
201 -
 202
202 -
 203
203 -
 204
204 -
 205
205 -
 206
206 -
 207
207 -
 208
208 -
 209
209 -
210
-
211
-
212
-
213
-
214
-
215
-
216
-
217
-
218
-
219
-
220
-
221
-
222
-
223
-
224
-
225
-
226
-
227
-
228
-
229
-
230
-
231
-
232
-
233
-
234
-
235
-
236
-
237
-
238
-
239
-
240
-
241
-
242
-
243
-
244
-
245
-
246
-
247
-
248
-
249
-
250
-
251
-
252
-
253
-
254
-
255
-
256
-
257
-
258
-
259
-
260
-
261
-
262
-
263
-
264
-
265
-
266
-
267
-
268
-
269
-
270
-
271
-
272
-
273
-
274
-
275
-
276
-
277
-
278
-
279
-
280
-
281
-
282
-
283
-
284
-
285
-
286
-
287
-
288
-
289
-
290
-
291
-
292
-
293
-
294
-
295
-
296
-
297
-
298
-
299
-
300
-
301
-
302
-
303
-
304
-
305
-
306
-
307
-
308
-
309
-
310
-
311
-
312
-
313
-
314
-
315
-
316
-
317
-
318
-
319
-
320
-
321
-
322
-
323
-
324
-
325
-
326
-
327
 |
 |

182
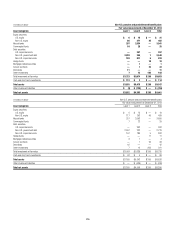
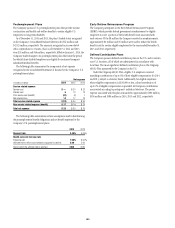
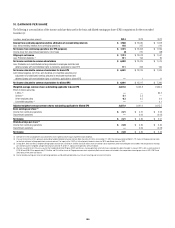
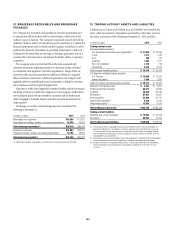
Deferred Income Taxes
Deferred income taxes at December 31 related to the following:
In millions of dollars 2014 2013
Deferred tax assets
Credit loss deduction $ 7,010 $ 8,356
Deferred compensation and employee benefits 4,676 4,067
Restructuring and settlement reserves 1,599 1,806
Unremitted foreign earnings 6,368 6,910
Investment and loan basis differences 4,979 4,409
Cash flow hedges 529 736
Tax credit and net operating loss carry-forwards 23,395 26,097
Fixed assets and leases 2,093 666
Other deferred tax assets 2,334 2,734
Gross deferred tax assets $52,983 $55,781
Valuation allowance ——
Deferred tax assets after valuation allowance $52,983 $55,781
Deferred tax liabilities
Deferred policy acquisition costs
and value of insurance in force $ (415) $ (455)
Intangibles (1,636) (1,076)
Debt issuances (866) (811)
Other deferred tax liabilities (559) (640)
Gross deferred tax liabilities $ (3,476) $ (2,982)
Net deferred tax assets $49,507 $52,799
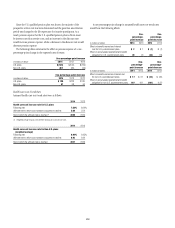
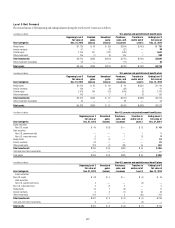
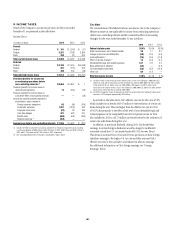
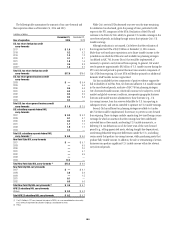
Unrecognized Tax Benefits
The following is a roll-forward of the Company’s unrecognized tax benefits.
In millions of dollars 2014 2013 2012
Total unrecognized tax benefits at January 1 $ 1,574 $ 3,109 $ 3,923
Net amount of increases for current year’s tax positions 135 58 136
Gross amount of increases for prior years’ tax positions 175 251 345
Gross amount of decreases for prior years’ tax positions (772) (716) (1,246)
Amounts of decreases relating to settlements (28) (1,115) (44)
Reductions due to lapse of statutes of limitation (30) (15) (3)
Foreign exchange, acquisitions and dispositions 62 (2)
Total unrecognized tax benefits at December 31 $ 1,060 $ 1,574 $ 3,109
The total amounts of unrecognized tax benefits at December 31, 2014,
2013 and 2012 that, if recognized, would affect Citi’s effective tax rate,
are $0.8 billion, $0.8 billion and $1.3 billion, respectively. The remaining
uncertain tax positions have offsetting amounts in other jurisdictions or are
temporary differences, except for $0.4 billion at December 31, 2013, which
was recognized in Retained earnings in 2014.
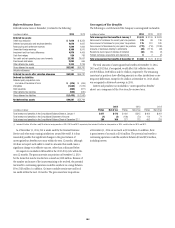
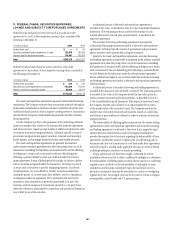
Interest and penalties (not included in “unrecognized tax benefits”
above) are a component of the Provision for income taxes.
2014 2013 2012
In millions of dollars Pretax Net of tax Pretax Net of tax Pretax Net of tax
Total interest and penalties in the Consolidated Balance Sheet at January 1 $ 277 $ 173 $ 492 $ 315 $ 404 $ 261
Total interest and penalties in the Consolidated Statement of Income (1) (1) (108) (72) 114 71
Total interest and penalties in the Consolidated Balance Sheet at December 31 (1) 269 169 277 173 492 315
(1) Includes $2 million, $2 million, and $10 million for foreign penalties in 2014, 2013 and 2012, respectively. Also includes $3 million for state penalties in 2014, and $4 million for 2013 and 2012.
As of December 31, 2014, Citi is under audit by the Internal Revenue
Service and other major taxing jurisdictions around the world. It is thus
reasonably possible that significant changes in the gross balance of
unrecognized tax benefits may occur within the next 12 months, although
Citi does not expect such audits to result in amounts that would cause a
significant change to its effective tax rate, other than as discussed below.
Citi expects to conclude its IRS audit for the 2012-2013 cycle within the
next 12 months. The gross uncertain tax positions at December 31, 2014
for the items that may be resolved are as much as $120 million. Because of
the number and nature of the issues remaining to be resolved, the potential
tax benefit to continuing operations could be anywhere in a range between
$0 to $120 million. In addition, Citi may conclude certain state and local
tax audits within the next 12 months. The gross uncertain tax positions
at December 31, 2014 are as much as $214 million. In addition, there
is gross interest of as much as $146 million. The potential tax benefit to
continuing operations could be anywhere between $0 and $230 million,
including interest.