Citibank 2014 Annual Report Download - page 188
Download and view the complete annual report
Please find page 188 of the 2014 Citibank annual report below. You can navigate through the pages in the report by either clicking on the pages listed below, or by using the keyword search tool below to find specific information within the annual report.-
 1
1 -
2
-
3
-
4
-
5
-
6
-
7
-
8
-
9
-
10
-
11
-
12
-
13
-
14
-
15
-
16
-
17
-
18
-
19
-
20
-
21
-
22
-
23
-
24
-
25
-
26
-
27
-
28
-
29
-
30
-
31
-
32
-
33
-
34
-
35
-
36
-
37
-
38
-
39
-
40
-
41
-
42
-
43
-
44
-
45
-
46
-
47
-
48
-
49
-
50
-
51
-
52
-
53
-
54
-
55
-
56
-
57
-
58
-
59
-
60
-
61
-
62
-
63
-
64
-
65
-
66
-
67
-
68
-
69
-
70
-
71
-
72
-
73
-
74
-
75
-
76
-
77
-
78
-
79
-
80
-
81
-
82
-
83
-
84
-
85
-
86
-
87
-
88
-
89
-
90
-
91
-
92
-
93
-
94
-
95
-
96
-
97
-
98
-
99
-
100
-
101
-
102
-
103
-
104
-
105
-
106
-
107
-
108
-
109
-
110
-
111
-
112
-
113
-
114
-
115
-
116
-
117
-
118
-
119
-
120
-
121
-
122
-
123
-
124
-
125
-
126
-
127
-
128
-
129
-
130
-
131
-
132
-
133
-
134
-
135
-
136
-
137
-
138
-
139
-
140
-
141
-
142
-
143
-
144
-
145
-
146
-
147
-
148
-
149
-
150
-
151
-
152
-
153
-
154
-
155
-
156
-
157
-
158
-
159
-
160
-
161
-
162
-
163
-
164
-
165
-
166
-
167
-
168
-
169
-
170
-
171
-
172
-
173
-
174
-
175
-
176
-
177
-
 178
178 -
 179
179 -
 180
180 -
 181
181 -
 182
182 -
 183
183 -
 184
184 -
 185
185 -
 186
186 -
 187
187 -
 188
188 -
 189
189 -
 190
190 -
 191
191 -
 192
192 -
 193
193 -
 194
194 -
 195
195 -
 196
196 -
 197
197 -
 198
198 -
199
-
200
-
201
-
202
-
203
-
204
-
205
-
206
-
207
-
208
-
209
-
210
-
211
-
212
-
213
-
214
-
215
-
216
-
217
-
218
-
219
-
220
-
221
-
222
-
223
-
224
-
225
-
226
-
227
-
228
-
229
-
230
-
231
-
232
-
233
-
234
-
235
-
236
-
237
-
238
-
239
-
240
-
241
-
242
-
243
-
244
-
245
-
246
-
247
-
248
-
249
-
250
-
251
-
252
-
253
-
254
-
255
-
256
-
257
-
258
-
259
-
260
-
261
-
262
-
263
-
264
-
265
-
266
-
267
-
268
-
269
-
270
-
271
-
272
-
273
-
274
-
275
-
276
-
277
-
278
-
279
-
280
-
281
-
282
-
283
-
284
-
285
-
286
-
287
-
288
-
289
-
290
-
291
-
292
-
293
-
294
-
295
-
296
-
297
-
298
-
299
-
300
-
301
-
302
-
303
-
304
-
305
-
306
-
307
-
308
-
309
-
310
-
311
-
312
-
313
-
314
-
315
-
316
-
317
-
318
-
319
-
320
-
321
-
322
-
323
-
324
-
325
-
326
-
327
 |
 |

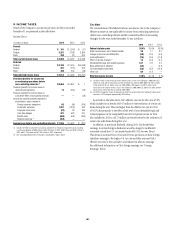
171
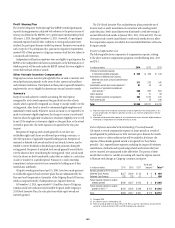
Discount Rate
The discount rates for the U.S. pension and postretirement plans were selected
by reference to a Citigroup-specific analysis using each plan’s specific
cash flows and compared with high-quality corporate bond indices for
reasonableness. Citigroup’s policy is to round to the nearest five hundredths
of a percent. The discount rates for the non-U.S. pension and postretirement
plans are selected by reference to high-quality corporate bond rates in
countries that have developed corporate bond markets. However, where
developed corporate bond markets do not exist, the discount rates are selected
by reference to local government bond rates with a premium added to reflect
the additional risk for corporate bonds in certain countries.
Expected Rate of Return
The Company determines its assumptions for the expected rate of return
on plan assets for its U.S. pension and postretirement plans using a
“building block” approach, which focuses on ranges of anticipated rates
of return for each asset class. A weighted average range of nominal rates
is then determined based on target allocations to each asset class. Market
performance over a number of earlier years is evaluated covering a wide
range of economic conditions to determine whether there are sound reasons
for projecting any past trends.
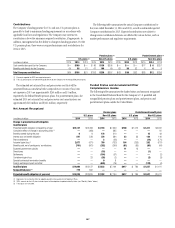
The Company considers the expected rate of return to be a long-term
assessment of return expectations and does not anticipate changing this
assumption unless there are significant changes in investment strategy
or economic conditions. This contrasts with the selection of the discount
rate and certain other assumptions, which are reconsidered annually
(or quarterly for the Significant Plans) in accordance with GAAP.
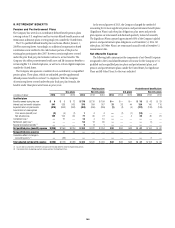
The expected rate of return for the U.S. pension and postretirement plans
was 7.00% at December 31, 2014, 2013 and 2012. The expected return on
assets reflects the expected annual appreciation of the plan assets and reduces
the Company’s annual pension expense. The expected return on assets is
deducted from the sum of service cost, interest cost and other components of
pension expense to arrive at the net pension (benefit) expense. Net pension
(benefit) expense for the U.S. pension plans for 2014, 2013 and 2012 reflects
deductions of $878 million, $863 million and $897 million of expected
returns, respectively.
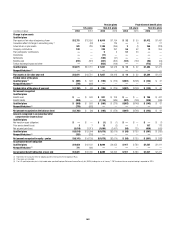
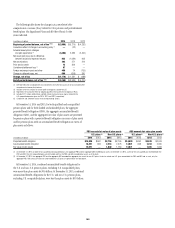
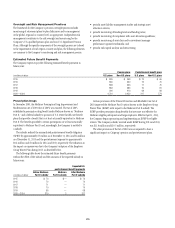
The following table shows the expected rates of return used in
determining the Company’s pension expense compared to the actual rate of
return on plan assets during 2014, 2013 and 2012 for the U.S. pension and
postretirement plans:
2014 2013 2012
Expected rate of return (1) 7.00% 7.00% 7.50%
Actual rate of return (2) 7.80% 6.00% 11.00%
(1) Effective December 31, 2012, the expected rate of return was changed from 7.50% to 7.00%.
(2) Actual rates of return are presented net of fees.
For the non-U.S. plans, pension expense for 2014 was reduced by
the expected return of $384 million, compared with the actual return of
$1,108 million. Pension expense for 2013 and 2012 was reduced by expected
returns of $396 million and $399 million, respectively. Actual returns were
lower in 2013, but higher in 2014 and 2012 than the expected returns in
those years.
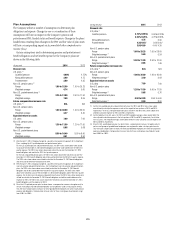
Mortality Tables
At December 31, 2014, the Company adopted the Retirement Plan 2014
(RP-2014) and Mortality Projection 2014 (MP-2014) mortality tables for
U.S. plans.
2014 2013
Mortality
U.S. plans (1)(2)
Pension RP-2014/MP-2014 IRS RP-2000(2014)
Postretirement RP-2014/MP-2014 IRS RP-2000(2014)
(1) The RP-2014 table is the white-collar RP-2014 table, with a 4% increase in rates to reflect the
Citigroup-specific mortality experience. The MP-2014 projection scale includes a phase-out of the
assumed rates of improvements from 2015 to 2027.
(2) The IRS mortality table (static version) includes a 7-year projection (from the measurement date) after
retirement and 15-year projection (from the measurement date) prior to retirement using Projection
Scale AA.
Adjustments were made to the RP-2014 tables and to the long-term rate
of mortality improvement to reflect Citigroup specific experience. As a result,
the U.S. qualified and nonqualified pension and postretirement plans’ PBO
at December 31, 2014 increased by $1,209 million and its funded status and
AOCI decreased by $1,209 million ($737 million, net of tax). In addition, the
2015 qualified and nonqualified pension and postretirement benefit expense
is expected to increase by approximately $73 million.
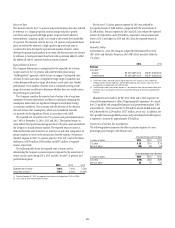
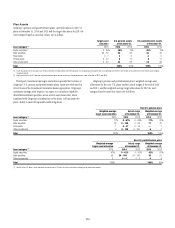
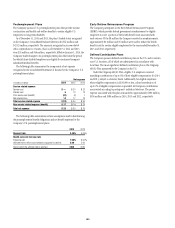
Sensitivities of Certain Key Assumptions
The following tables summarize the effect on pension expense of a one-
percentage-point change in the discount rate:
One-percentage-point increase
In millions of dollars 2014 2013 2012
U.S. plans $ 28 $ 16 $ 18
Non-U.S. plans (39) (52) (48)
One-percentage-point decrease
In millions of dollars 2014 2013 2012
U.S. plans $(45) $(57) $(36)
Non-U.S. plans 56 79 64