Citibank 2014 Annual Report Download - page 47
Download and view the complete annual report
Please find page 47 of the 2014 Citibank annual report below. You can navigate through the pages in the report by either clicking on the pages listed below, or by using the keyword search tool below to find specific information within the annual report.-
 1
1 -
2
-
3
-
4
-
5
-
6
-
7
-
8
-
9
-
10
-
11
-
12
-
13
-
14
-
15
-
16
-
17
-
18
-
19
-
20
-
21
-
22
-
23
-
24
-
25
-
26
-
27
-
28
-
29
-
30
-
31
-
32
-
33
-
34
-
35
-
36
-
 37
37 -
 38
38 -
 39
39 -
 40
40 -
 41
41 -
 42
42 -
 43
43 -
 44
44 -
 45
45 -
 46
46 -
 47
47 -
 48
48 -
 49
49 -
 50
50 -
 51
51 -
 52
52 -
 53
53 -
 54
54 -
 55
55 -
 56
56 -
 57
57 -
58
-
59
-
60
-
61
-
62
-
63
-
64
-
65
-
66
-
67
-
68
-
69
-
70
-
71
-
72
-
73
-
74
-
75
-
76
-
77
-
78
-
79
-
80
-
81
-
82
-
83
-
84
-
85
-
86
-
87
-
88
-
89
-
90
-
91
-
92
-
93
-
94
-
95
-
96
-
97
-
98
-
99
-
100
-
101
-
102
-
103
-
104
-
105
-
106
-
107
-
108
-
109
-
110
-
111
-
112
-
113
-
114
-
115
-
116
-
117
-
118
-
119
-
120
-
121
-
122
-
123
-
124
-
125
-
126
-
127
-
128
-
129
-
130
-
131
-
132
-
133
-
134
-
135
-
136
-
137
-
138
-
139
-
140
-
141
-
142
-
143
-
144
-
145
-
146
-
147
-
148
-
149
-
150
-
151
-
152
-
153
-
154
-
155
-
156
-
157
-
158
-
159
-
160
-
161
-
162
-
163
-
164
-
165
-
166
-
167
-
168
-
169
-
170
-
171
-
172
-
173
-
174
-
175
-
176
-
177
-
178
-
179
-
180
-
181
-
182
-
183
-
184
-
185
-
186
-
187
-
188
-
189
-
190
-
191
-
192
-
193
-
194
-
195
-
196
-
197
-
198
-
199
-
200
-
201
-
202
-
203
-
204
-
205
-
206
-
207
-
208
-
209
-
210
-
211
-
212
-
213
-
214
-
215
-
216
-
217
-
218
-
219
-
220
-
221
-
222
-
223
-
224
-
225
-
226
-
227
-
228
-
229
-
230
-
231
-
232
-
233
-
234
-
235
-
236
-
237
-
238
-
239
-
240
-
241
-
242
-
243
-
244
-
245
-
246
-
247
-
248
-
249
-
250
-
251
-
252
-
253
-
254
-
255
-
256
-
257
-
258
-
259
-
260
-
261
-
262
-
263
-
264
-
265
-
266
-
267
-
268
-
269
-
270
-
271
-
272
-
273
-
274
-
275
-
276
-
277
-
278
-
279
-
280
-
281
-
282
-
283
-
284
-
285
-
286
-
287
-
288
-
289
-
290
-
291
-
292
-
293
-
294
-
295
-
296
-
297
-
298
-
299
-
300
-
301
-
302
-
303
-
304
-
305
-
306
-
307
-
308
-
309
-
310
-
311
-
312
-
313
-
314
-
315
-
316
-
317
-
318
-
319
-
320
-
321
-
322
-
323
-
324
-
325
-
326
-
327
 |
 |
30
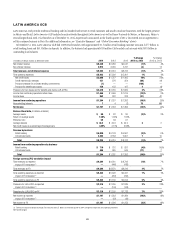
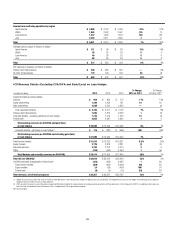
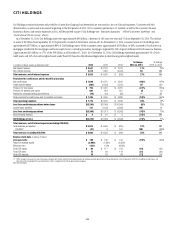
The discussion of the results of operations for Citi Holdings below excludes the impact of CVA/DVA for all periods presented. Presentations of the results
of operations, excluding the impact of CVA/DVA, are non-GAAP financial measures. Citi believes the presentation of Citi Holdings’ results excluding the
impact of CVA/DVA is a more meaningful depiction of the underlying fundamentals of the business. For a reconciliation of these metrics to the reported
results, see the table above.
2014 vs. 2013
The net loss increased by $1.4 billion to $3.3 billion, largely due to the
impact of the mortgage settlement in July 2014 (see “Executive Summary”
above), partially offset by higher revenues and lower cost of credit.
Excluding the mortgage settlement, net income increased by $2.3 billion to
$385 million, primarily due to lower expenses, higher revenues and lower net
credit losses, partially offset by a lower net loan loss reserve release.
Revenues increased 28%, primarily driven by gains on asset sales,
including the sales of the consumer operations in Greece and Spain in the
third quarter of 2014, lower funding costs and the absence of residential
mortgage repurchase reserve builds for representation and warranty claims
in 2014, partially offset by losses on the redemption of debt associated with
funding Citi Holdings assets.
Expenses increased 29%, principally reflecting higher legal and related
costs ($4.7 billion compared to $2.6 billion in 2013) due to the mortgage
settlement, partially offset by lower expenses driven by the ongoing decline
in assets. Excluding the impact of the mortgage settlement, expenses
declined 34%, primarily driven by lower legal and related costs ($986 million
compared to $2.6 billion in 2013) as well as the ongoing decline in assets.
Provisions decreased 18%, driven by lower net credit losses, partially
offset by a lower net loss reserve release. Excluding the impact of the
mortgage settlement, provisions declined 22%, driven by a 46% decline in
net credit losses primarily due to continued improvements in North America
mortgages and overall lower asset levels. The net reserve release decreased
56% to $903 million, primarily due to lower releases related to the North
America mortgage portfolio, partially offset by lower losses on asset sales.
Excluding the impact of the mortgage settlement, the net reserve release
decreased 53%. Loan loss reserves related to the North America mortgage
portfolio were utilized to nearly fully offset net credit losses in the portfolio
in 2014.
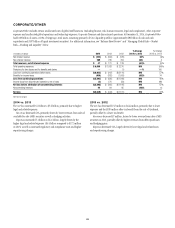
2013 vs. 2012
The net loss decreased by 71% to $1.9 billion. 2012 included the pretax
loss of $4.7 billion ($2.9 billion after-tax) related to the sale of the Morgan
Stanley Smith Barney joint venture (MSSB) to Morgan Stanley. Excluding
the MSSB loss, the net loss decreased to $1.9 billion from a net loss of
$3.8 billion in 2012, due to significantly lower provisions for credit losses and
higher revenues, partially offset by higher expenses.
Revenues increased to $4.6 billion, primarily due to the absence of the
MSSB loss. Excluding the MSSB loss, revenues increased 23%, primarily
driven by lower funding costs and lower residential mortgage repurchase
reserve builds for representation and warranty claims ($470 million,
compared to $700 million in 2012).
Expenses increased 13%, primarily due to higher legal and related costs
($2.6 billion in 2013 compared to $1.2 billion in 2012), driven largely
by legacy private-label securitization and other mortgage-related issues,
partially offset by lower overall assets. Excluding legal and related costs,
expenses declined 18% versus 2012.
Provisions decreased 66%, driven by the absence of incremental net
credit losses relating to the national mortgage settlement and those required
by Office of the Comptroller of the Currency (OCC) guidance during 2012
(for additional information, see Note 16 to the Consolidated Financial
Statements), as well as improved credit in North America mortgages
and overall lower asset levels. Loan loss reserve releases increased 27% to
$2 billion, which included a loan loss reserve release of approximately
$2.2 billion related to the North America mortgage portfolio, partially offset
by losses on asset sales.
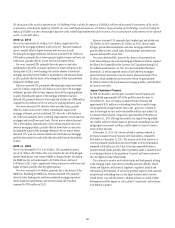
Japan Consumer Finance
In 2008, Citi decided to exit its Japan Consumer Finance business and
has liquidated approximately 95% of the portfolio since that time. As
of December 31, 2014, Citi’s Japan Consumer Finance business had
approximately $151 million in outstanding loans that currently charge
or have previously charged interest rates in the “gray zone” (interest at
rates that are legal but may not be enforceable and thus may subject Citi
to customer refund claims), compared to approximately $278 million as
of December 31, 2013. Although the portfolio has largely been liquidated,
Citi could be subject to refund claims on previously outstanding loans that
charged gray zone interest and thus could be subject to losses on loans in
excess of these amounts.
At December 31, 2014, Citi’s reserves related to customer refunds in
the Japan Consumer Finance business were $442 million, compared to
$434 million at December 31, 2013. The increase in the total reserve year-
over-year primarily resulted from net reserve builds in 2014 ($248 million
compared to $28 million in 2013) due to less than expected declines in
customer refund claims, partially offset by payments made to customers and
a continuing reduction in the population of current and former customers
who are eligible to make refund claims.
Citi continues to monitor and evaluate trends and developments relating
to the charging of gray zone interest, including customer defaults, refund
claims and litigation, and financial, legislative, regulatory, judicial and
other political developments, as well as the potential impact to both currently
and previously outstanding loans in this legacy business and its reserves
related thereto. Citi could be subject to additional losses as a result of these
developments and the impact on Citi is subject to uncertainty and continues
to be difficult to predict.