Citibank 2014 Annual Report Download - page 64
Download and view the complete annual report
Please find page 64 of the 2014 Citibank annual report below. You can navigate through the pages in the report by either clicking on the pages listed below, or by using the keyword search tool below to find specific information within the annual report.-
 1
1 -
2
-
3
-
4
-
5
-
6
-
7
-
8
-
9
-
10
-
11
-
12
-
13
-
14
-
15
-
16
-
17
-
18
-
19
-
20
-
21
-
22
-
23
-
24
-
25
-
26
-
27
-
28
-
29
-
30
-
31
-
32
-
33
-
34
-
35
-
36
-
37
-
38
-
39
-
40
-
41
-
42
-
43
-
44
-
45
-
46
-
47
-
48
-
49
-
50
-
51
-
52
-
53
-
 54
54 -
 55
55 -
 56
56 -
 57
57 -
 58
58 -
 59
59 -
 60
60 -
 61
61 -
 62
62 -
 63
63 -
 64
64 -
 65
65 -
 66
66 -
 67
67 -
 68
68 -
 69
69 -
 70
70 -
 71
71 -
 72
72 -
 73
73 -
 74
74 -
75
-
76
-
77
-
78
-
79
-
80
-
81
-
82
-
83
-
84
-
85
-
86
-
87
-
88
-
89
-
90
-
91
-
92
-
93
-
94
-
95
-
96
-
97
-
98
-
99
-
100
-
101
-
102
-
103
-
104
-
105
-
106
-
107
-
108
-
109
-
110
-
111
-
112
-
113
-
114
-
115
-
116
-
117
-
118
-
119
-
120
-
121
-
122
-
123
-
124
-
125
-
126
-
127
-
128
-
129
-
130
-
131
-
132
-
133
-
134
-
135
-
136
-
137
-
138
-
139
-
140
-
141
-
142
-
143
-
144
-
145
-
146
-
147
-
148
-
149
-
150
-
151
-
152
-
153
-
154
-
155
-
156
-
157
-
158
-
159
-
160
-
161
-
162
-
163
-
164
-
165
-
166
-
167
-
168
-
169
-
170
-
171
-
172
-
173
-
174
-
175
-
176
-
177
-
178
-
179
-
180
-
181
-
182
-
183
-
184
-
185
-
186
-
187
-
188
-
189
-
190
-
191
-
192
-
193
-
194
-
195
-
196
-
197
-
198
-
199
-
200
-
201
-
202
-
203
-
204
-
205
-
206
-
207
-
208
-
209
-
210
-
211
-
212
-
213
-
214
-
215
-
216
-
217
-
218
-
219
-
220
-
221
-
222
-
223
-
224
-
225
-
226
-
227
-
228
-
229
-
230
-
231
-
232
-
233
-
234
-
235
-
236
-
237
-
238
-
239
-
240
-
241
-
242
-
243
-
244
-
245
-
246
-
247
-
248
-
249
-
250
-
251
-
252
-
253
-
254
-
255
-
256
-
257
-
258
-
259
-
260
-
261
-
262
-
263
-
264
-
265
-
266
-
267
-
268
-
269
-
270
-
271
-
272
-
273
-
274
-
275
-
276
-
277
-
278
-
279
-
280
-
281
-
282
-
283
-
284
-
285
-
286
-
287
-
288
-
289
-
290
-
291
-
292
-
293
-
294
-
295
-
296
-
297
-
298
-
299
-
300
-
301
-
302
-
303
-
304
-
305
-
306
-
307
-
308
-
309
-
310
-
311
-
312
-
313
-
314
-
315
-
316
-
317
-
318
-
319
-
320
-
321
-
322
-
323
-
324
-
325
-
326
-
327
 |
 |

47
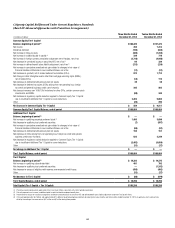
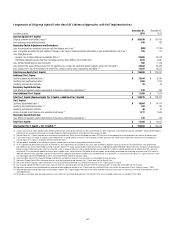
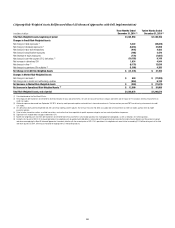
Components of Citigroup Capital Under Basel III (Advanced Approaches with Full Implementation)
In millions of dollars
December 31,
2014
December 31,
2013
Common Equity Tier 1 Capital
Citigroup common stockholders’ equity (1) $ 200,190 $ 197,694
Add: Qualifying noncontrolling interests 165 182
Regulatory Capital Adjustments and Deductions:
Less: Accumulated net unrealized losses on cash flow hedges, net of tax (2) (909) (1,245)
Less: Cumulative unrealized net gain related to changes in fair value of financial liabilities attributable to own creditworthiness, net of tax (3) 279 177
Less: Intangible assets:
Goodwill, net of related deferred tax liabilities (DTLs) (4) 22,805 24,518
Identifiable intangible assets other than mortgage servicing rights (MSRs), net of related DTLs 4,373 4,950
Less: Defined benefit pension plan net assets 936 1,125
Less: Deferred tax assets (DTAs) arising from net operating loss, foreign tax credit and general business credit carry-forwards (5) 23,628 26,439
Less: Excess over 10%/15% limitations for other DTAs, certain common stock investments, and MSRs (5)(6) 12,437 16,315
Total Common Equity Tier 1 Capital $ 136,806 $ 125,597
Additional Tier 1 Capital
Qualifying perpetual preferred stock (1) $ 10,344 $ 6,645
Qualifying trust preferred securities (7) 1,369 1,374
Qualifying noncontrolling interests 35 39
Regulatory Capital Deduction:
Less: Minimum regulatory capital requirements of insurance underwriting subsidiaries (8) 279 243
Total Additional Tier 1 Capital $ 11,469 $ 7,815
Total Tier 1 Capital (Common Equity Tier 1 Capital + Additional Tier 1 Capital) $ 148,275 $ 133,412
Tier 2 Capital
Qualifying subordinated debt (9) $ 16,094 $ 14,414
Qualifying trust preferred securities (10) 350 745
Qualifying noncontrolling interests 46 52
Excess of eligible credit reserves over expected credit losses (11) 1,177 1,669
Regulatory Capital Deduction:
Less: Minimum regulatory capital requirements of insurance underwriting subsidiaries (8) 279 243
Total Tier 2 Capital $ 17,388 $ 16,637
Total Capital (Tier 1 Capital + Tier 2 Capital) (12) $ 165,663 $ 150,049
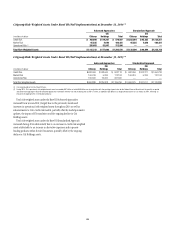
(1) Issuance costs of $124 million and $93 million related to preferred stock outstanding at December 31, 2014 and December 31, 2013, respectively, are excluded from common stockholders’ equity and netted against
preferred stock in accordance with Federal Reserve Board regulatory reporting requirements, which differ from those under U.S. GAAP.
(2) Common Equity Tier 1 Capital is adjusted for accumulated net unrealized gains (losses) on cash flow hedges included in AOCI that relate to the hedging of items not recognized at fair value on the balance sheet.
(3) The cumulative impact of changes in Citigroup’s own creditworthiness in valuing liabilities for which the fair value option has been elected and own-credit valuation adjustments on derivatives are excluded from
Common Equity Tier 1 Capital, in accordance with the Final Basel III Rules.
(4) Includes goodwill “embedded” in the valuation of significant common stock investments in unconsolidated financial institutions.
(5) Of Citi’s approximately $49.5 billion of net DTAs at December 31, 2014, approximately $15.2 billion of such assets were includable in regulatory capital pursuant to the Final Basel III Rules, while approximately
$34.3 billion of such assets were excluded in arriving at Common Equity Tier 1 Capital. Comprising the excluded net DTAs was an aggregate of approximately $35.9 billion of net DTAs arising from net operating loss,
foreign tax credit and general business credit carry-forwards as well as temporary differences that were deducted from Common Equity Tier 1 Capital. In addition, approximately $1.6 billion of net DTLs, primarily
consisting of DTLs associated with goodwill and certain other intangible assets, partially offset by DTAs related to cash flow hedges, are permitted to be excluded prior to deriving the amount of net DTAs subject to
deduction under these rules. Separately, under the Final Basel III Rules, goodwill and these other intangible assets are deducted net of associated DTLs in arriving at Common Equity Tier 1 Capital, while Citi’s current
cash flow hedges and the related deferred tax effects are not required to be reflected in regulatory capital.
(6) Aside from MSRs, reflects DTAs arising from temporary differences and significant common stock investments in unconsolidated financial institutions.
(7) Represents Citigroup Capital XIII trust preferred securities, which are permanently grandfathered as Tier 1 Capital under the Final Basel III Rules.
(8) 50% of the minimum regulatory capital requirements of insurance underwriting subsidiaries must be deducted from each of Tier 1 Capital and Tier 2 Capital.
(9) Non-qualifying subordinated debt issuances which consist of those with a fixed-to-floating rate step-up feature where the call/step-up date has not passed are excluded from Tier 2 Capital.
(10) Represents the amount of non-grandfathered trust preferred securities eligible for inclusion in Tier 2 Capital under the Final Basel III Rules, which will be fully phased-out of Tier 2 Capital by January 1, 2022.
(11) Advanced Approaches banking organizations are permitted to include in Tier 2 Capital eligible credit reserves that exceed expected credit losses to the extent that the excess reserves do not exceed 0.6% of credit
risk-weighted assets.
(12) Total Capital as calculated under Advanced Approaches, which differs from the Standardized Approach in the treatment of the amount of eligible credit reserves includable in Tier 2 Capital.