Citibank 2014 Annual Report Download - page 316
Download and view the complete annual report
Please find page 316 of the 2014 Citibank annual report below. You can navigate through the pages in the report by either clicking on the pages listed below, or by using the keyword search tool below to find specific information within the annual report.-
 1
1 -
2
-
3
-
4
-
5
-
6
-
7
-
8
-
9
-
10
-
11
-
12
-
13
-
14
-
15
-
16
-
17
-
18
-
19
-
20
-
21
-
22
-
23
-
24
-
25
-
26
-
27
-
28
-
29
-
30
-
31
-
32
-
33
-
34
-
35
-
36
-
37
-
38
-
39
-
40
-
41
-
42
-
43
-
44
-
45
-
46
-
47
-
48
-
49
-
50
-
51
-
52
-
53
-
54
-
55
-
56
-
57
-
58
-
59
-
60
-
61
-
62
-
63
-
64
-
65
-
66
-
67
-
68
-
69
-
70
-
71
-
72
-
73
-
74
-
75
-
76
-
77
-
78
-
79
-
80
-
81
-
82
-
83
-
84
-
85
-
86
-
87
-
88
-
89
-
90
-
91
-
92
-
93
-
94
-
95
-
96
-
97
-
98
-
99
-
100
-
101
-
102
-
103
-
104
-
105
-
106
-
107
-
108
-
109
-
110
-
111
-
112
-
113
-
114
-
115
-
116
-
117
-
118
-
119
-
120
-
121
-
122
-
123
-
124
-
125
-
126
-
127
-
128
-
129
-
130
-
131
-
132
-
133
-
134
-
135
-
136
-
137
-
138
-
139
-
140
-
141
-
142
-
143
-
144
-
145
-
146
-
147
-
148
-
149
-
150
-
151
-
152
-
153
-
154
-
155
-
156
-
157
-
158
-
159
-
160
-
161
-
162
-
163
-
164
-
165
-
166
-
167
-
168
-
169
-
170
-
171
-
172
-
173
-
174
-
175
-
176
-
177
-
178
-
179
-
180
-
181
-
182
-
183
-
184
-
185
-
186
-
187
-
188
-
189
-
190
-
191
-
192
-
193
-
194
-
195
-
196
-
197
-
198
-
199
-
200
-
201
-
202
-
203
-
204
-
205
-
206
-
207
-
208
-
209
-
210
-
211
-
212
-
213
-
214
-
215
-
216
-
217
-
218
-
219
-
220
-
221
-
222
-
223
-
224
-
225
-
226
-
227
-
228
-
229
-
230
-
231
-
232
-
233
-
234
-
235
-
236
-
237
-
238
-
239
-
240
-
241
-
242
-
243
-
244
-
245
-
246
-
247
-
248
-
249
-
250
-
251
-
252
-
253
-
254
-
255
-
256
-
257
-
258
-
259
-
260
-
261
-
262
-
263
-
264
-
265
-
266
-
267
-
268
-
269
-
270
-
271
-
272
-
273
-
274
-
275
-
276
-
277
-
278
-
279
-
280
-
281
-
282
-
283
-
284
-
285
-
286
-
287
-
288
-
289
-
290
-
291
-
292
-
293
-
294
-
295
-
296
-
297
-
298
-
299
-
300
-
301
-
302
-
303
-
304
-
305
-
 306
306 -
 307
307 -
 308
308 -
 309
309 -
 310
310 -
 311
311 -
 312
312 -
 313
313 -
 314
314 -
 315
315 -
 316
316 -
 317
317 -
 318
318 -
 319
319 -
 320
320 -
 321
321 -
 322
322 -
 323
323 -
 324
324 -
 325
325 -
 326
326 -
327
 |
 |

299
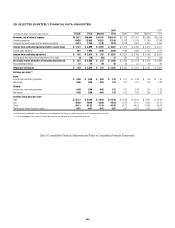
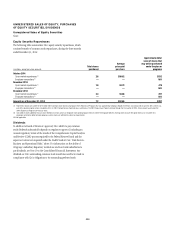
29. SELECTED QUARTERLY FINANCIAL DATA (UNAUDITED)
2014 2013
In millions of dollars, except per share amounts Fourth Third Second First Fourth Third Second First
Revenues, net of interest expense $17,812 $19,604 $19,342 $20,124 $17,779 $17,904 $20,488 $20,248
Operating expenses 14,426 12,955 15,521 12,149 12,293 11,679 12,149 12,288
Provisions for credit losses and for benefits and claims 2,013 1,750 1,730 1,974 2,072 1,959 2,024 2,459
Income from continuing operations before income taxes $ 1,373 $ 4,899 $ 2,091 $ 6,001 $ 3,414 $ 4,266 $ 6,315 $ 5,501
Income taxes (benefits) 991 1,985 1,838 2,050 1,090 1,080 2,127 1,570
Income from continuing operations $ 382 $ 2,914 $ 253 $ 3,951 $ 2,324 $ 3,186 $ 4,188 $ 3,931
Income (loss) from discontinued operations, net of taxes (1) (16) (22) 37 181 92 30 (33)
Net income before attribution of noncontrolling interests $ 381 $ 2,898 $ 231 $ 3,988 $ 2,505 $ 3,278 $ 4,218 $ 3,898
Noncontrolling interests 31 59 50 45 50 51 36 90
Citigroup’s net income $ 350 $ 2,839 $ 181 $ 3,943 $ 2,455 $ 3,227 $ 4,182 $ 3,808
Earnings per share (1)
Basic
Income from continuing operations $ 0.06 $ 0.89 $ 0.03 $ 1.22 $ 0.71 $ 0.98 $ 1.34 $ 1.24
Net income 0.06 0.88 0.03 1.24 0.77 1.01 1.35 1.23
Diluted
Income from continuing operations 0.06 0.88 0.03 1.22 0.71 0.98 1.33 1.24
Net income 0.06 0.88 0.03 1.23 0.77 1.00 1.34 1.23
Common stock price per share
High $ 56.37 $ 53.66 $ 49.58 $ 55.20 $ 53.29 $ 53.00 $ 53.27 $ 47.60
Low 49.68 46.90 45.68 46.34 47.67 47.67 42.50 41.15
Close 54.11 51.82 47.10 47.60 52.11 48.51 47.97 44.24
Dividends per share of common stock 0.01 0.01 0.01 0.01 0.01 0.01 0.01 0.01
This Note to the Consolidated Financial Statements is unaudited due to the Company’s individual quarterly results not being subject to an audit.
(1) Due to averaging of shares, quarterly earnings per share may not add up to the totals reported for the full year.
[End of Consolidated Financial Statements and Notes to Consolidated Financial Statements]